Recent Results
| Date | Matchup | Result / Time |
|---|---|---|
| Oct 18, 2026 | Buffalo Bills @ Las Vegas Raiders | Sun, Oct 18 4:25 PM ET |
| Oct 12, 2026 | Buffalo Bills @ Los Angeles Rams | Mon, Oct 12 8:15 PM ET |
| Oct 4, 2026 | Buffalo Bills vs New England Patriots | Sun, Oct 4 1:00 PM ET |
Upcoming Games
| Date | Matchup | Result / Time |
|---|---|---|
| Nov 1, 2026 | Buffalo Bills vs Baltimore Ravens | Sun, Nov 1 1:00 PM ET |
| Nov 9, 2026 | Buffalo Bills @ Minnesota Vikings | Mon, Nov 9 8:15 PM ET |
| Nov 15, 2026 | Buffalo Bills @ New York Jets | Sun, Nov 15 1:00 PM ET |

Buffalo Bills
5-1
🏟 Highmark Stadium (Old)
Division Standings
| Team | W | L | T | PCT | DIV | PF | PA | STRK |
|---|---|---|---|---|---|---|---|---|
| Kansas City Chiefs | 5 | 0 | 0 | 1.000 | - | 140 | 83 | W5 |
| Buffalo Bills | 5 | 1 | 0 | .833 | - | 197 | 171 | W2 |
| Jacksonville Jaguars | 4 | 2 | 0 | .667 | - | 154 | 104 | L1 |
| Cleveland Browns | 4 | 2 | 0 | .667 | - | 106 | 122 | W1 |
| Denver Broncos | 4 | 2 | 0 | .667 | - | 114 | 125 | W2 |
| Pittsburgh Steelers | 4 | 2 | 0 | .667 | - | 137 | 128 | W2 |
| Baltimore Ravens | 4 | 2 | 0 | .667 | - | 156 | 132 | L1 |
| Cincinnati Bengals | 3 | 2 | 0 | .600 | - | 128 | 109 | W1 |
| New England Patriots | 4 | 3 | 0 | .571 | - | 160 | 143 | L1 |
| Las Vegas Raiders | 3 | 3 | 0 | .500 | - | 162 | 162 | L3 |
| New York Jets | 2 | 4 | 0 | .333 | - | 112 | 122 | L1 |
| Indianapolis Colts | 2 | 4 | 0 | .333 | - | 144 | 164 | L2 |
| Houston Texans | 2 | 4 | 0 | .333 | - | 144 | 143 | W2 |
| Tennessee Titans | 1 | 5 | 0 | .167 | - | 84 | 129 | W1 |
| Miami Dolphins | 0 | 5 | 0 | .000 | - | 70 | 132 | L5 |
| Los Angeles Chargers | 0 | 6 | 0 | .000 | - | 90 | 151 | L6 |
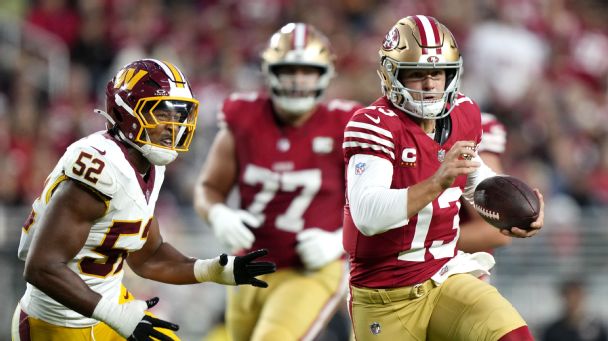
NFL execs, coaches rank the league's top five MVP candidates entering Week 7
Brock Purdy? Josh Allen? Or maybe even a non-QB? Sixteen execs and coaches voted on the top five contenders for the MVP award through six weeks.
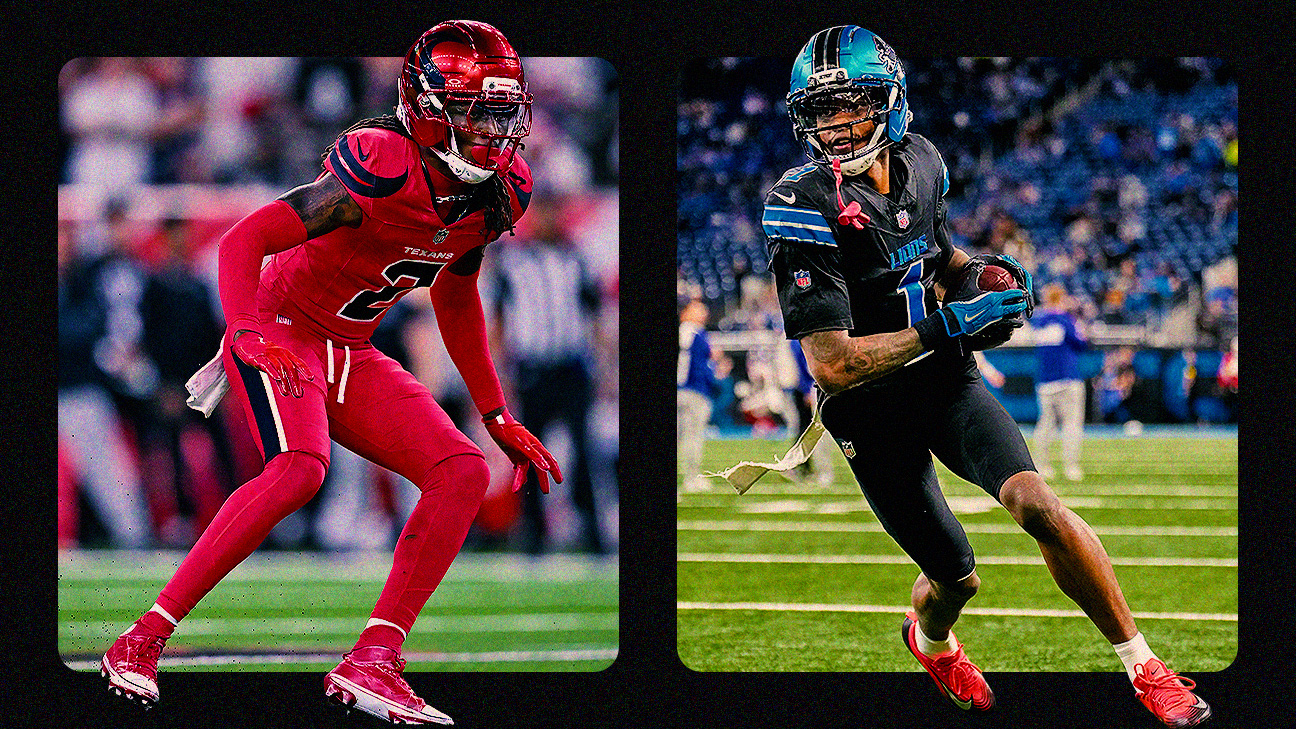
NFL Week 7 uniforms: Alternates galore as Texans go battle red, Lions all-black
Here's a look at what each NFL team is wearing in Week 7, led by alternate looks from Houston, Detroit and Dallas.
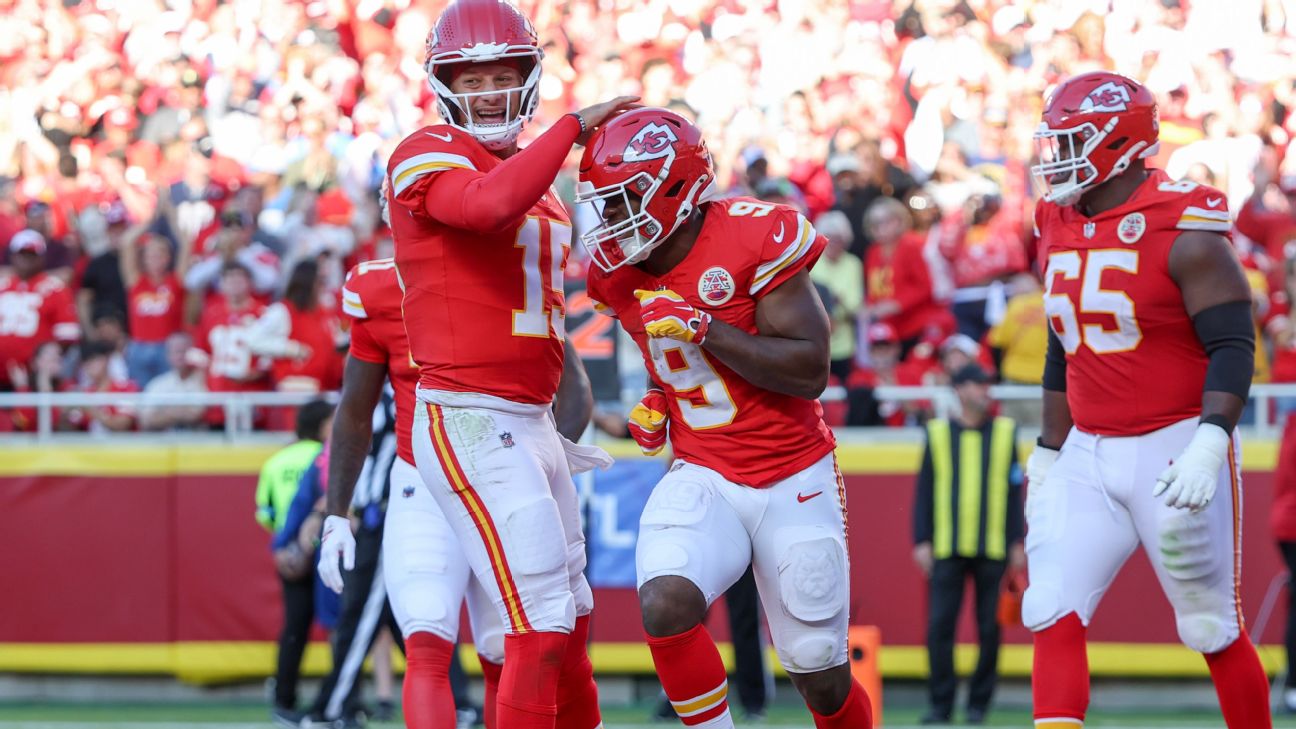
NFL Week 7 betting odds: Lines and totals for every game
A look at the odds, spreads, totals and FPI predictions for every NFL game in Week 7.
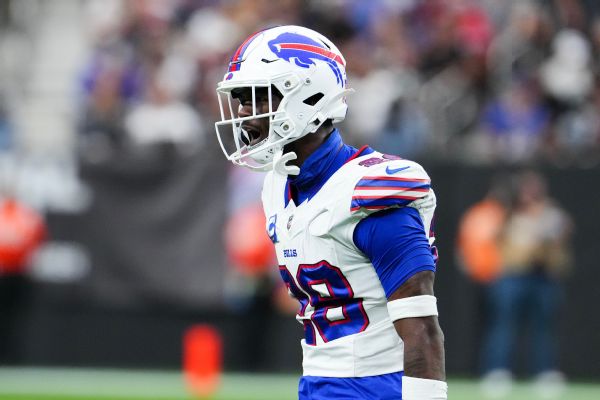
Bills' Sam Franklin wins appeal; suspension for spitting reduced to fine
Bills safety and special teams captain Sam Franklin Jr., has won his appeal to overturn the one-game suspension for supposedly spitting at an opponent in the win over the Raiders.
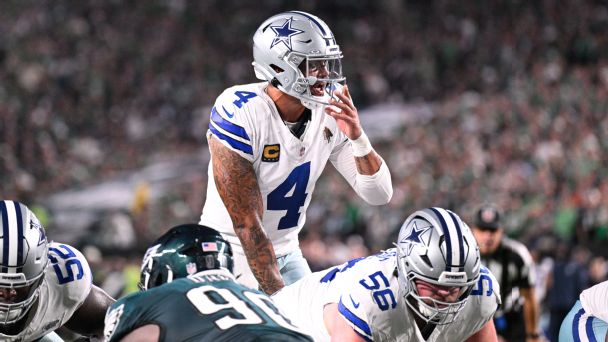
NFL Week 7 preview: Picks, predictions, schedule, betting odds, fantasy tips
Cowboys at Eagles? Bengals at Ravens? The Steelers and Saints in Paris? There are 13 more games in Week 7, and we have picks, predictions and more for all of them.
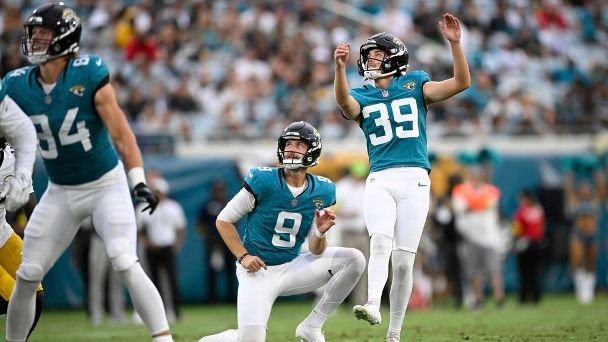
What are the longest field goals in NFL history?
Timely field goals can change game trajectories in a dramatic fashion. Check out the longest field goals in NFL history now.
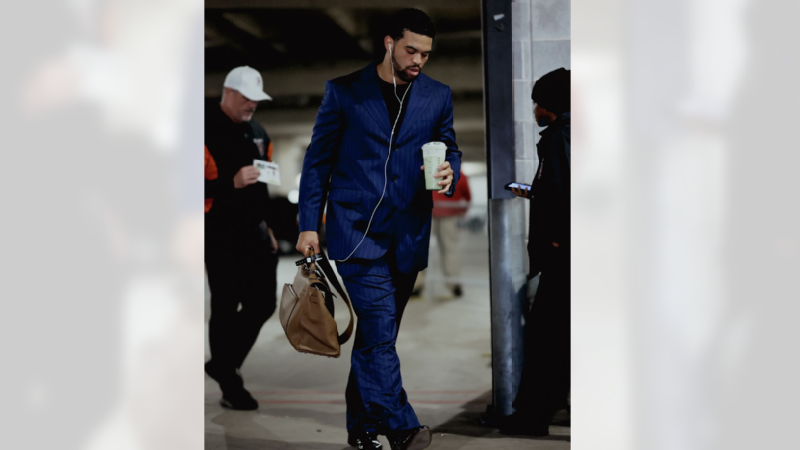
Bears QB Caleb Williams leads NFL Week 7's best arrivals
NFL stars continue to turn game-day arrivals into their own weekly fashion showcase.
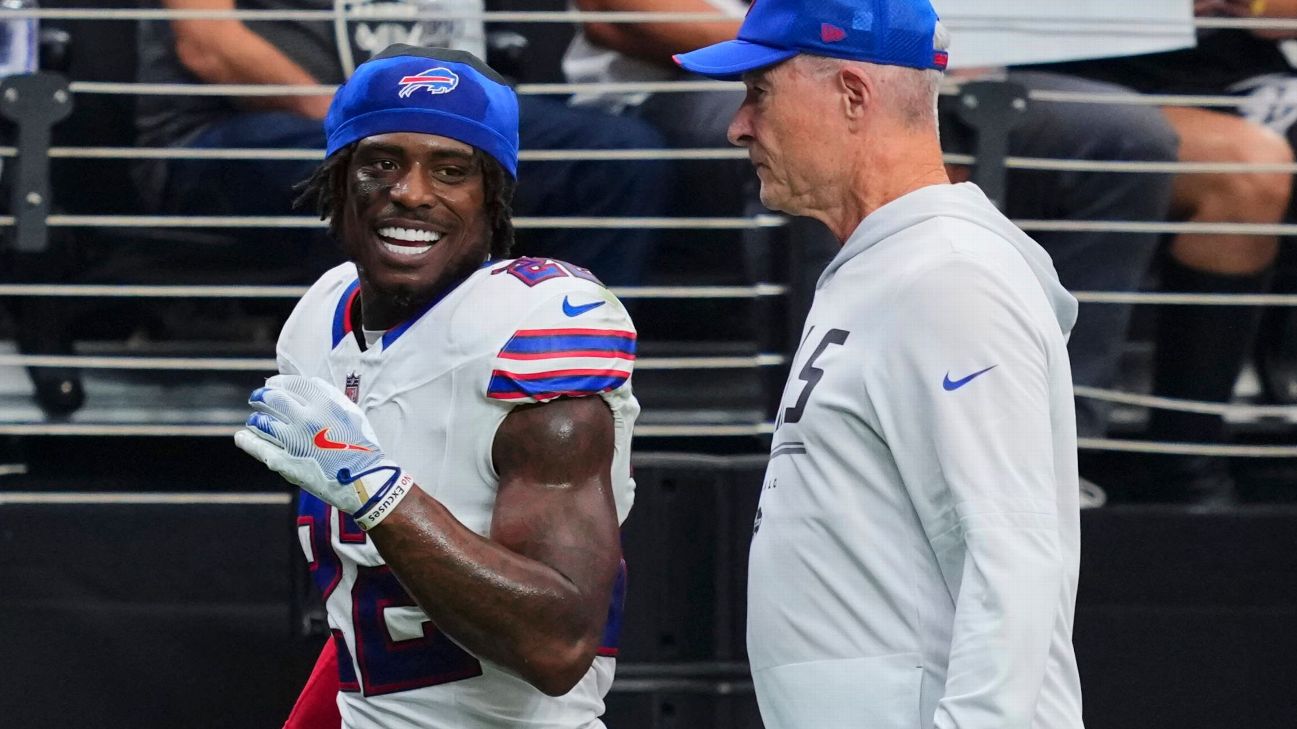
Bills DB Gardner-Johnson's one-game suspension for spitting stands after appeal
Bills safety C.J. Gardner-Johnson's one-game suspension for spitting at Raiders players in Sunday's game has been upheld by hearing officer Jordy Nelson.
| Date | Matchup | Result / Time |
|---|---|---|
| Sep 13, 2026 | Buffalo Bills @ Houston Texans | Sun, Sep 13 1:00 PM ET |
| Sep 17, 2026 | Buffalo Bills vs Detroit Lions | Thu, Sep 17 8:15 PM ET |
| Sep 27, 2026 | Buffalo Bills vs Los Angeles Chargers | Sun, Sep 27 1:00 PM ET |
| Oct 4, 2026 | Buffalo Bills vs New England Patriots | Sun, Oct 4 1:00 PM ET |
| Oct 12, 2026 | Buffalo Bills @ Los Angeles Rams | Mon, Oct 12 8:15 PM ET |
| Oct 18, 2026 | Buffalo Bills @ Las Vegas Raiders | Sun, Oct 18 4:25 PM ET |
| Nov 1, 2026 | Buffalo Bills vs Baltimore Ravens | Sun, Nov 1 1:00 PM ET |
| Nov 9, 2026 | Buffalo Bills @ Minnesota Vikings | Mon, Nov 9 8:15 PM ET |
| Nov 15, 2026 | Buffalo Bills @ New York Jets | Sun, Nov 15 1:00 PM ET |
| Nov 22, 2026 | Buffalo Bills vs Miami Dolphins | Sun, Nov 22 1:00 PM ET |
| Nov 26, 2026 | Buffalo Bills vs Kansas City Chiefs | Thu, Nov 26 8:20 PM ET |
| Dec 6, 2026 | Buffalo Bills @ New England Patriots | Sun, Dec 6 4:25 PM ET |
| Dec 13, 2026 | Buffalo Bills @ Green Bay Packers | Sun, Dec 13 8:20 PM ET |
| Dec 19, 2026 | Buffalo Bills vs Chicago Bears | Sat, Dec 19 8:20 PM ET |
| Dec 25, 2026 | Buffalo Bills @ Denver Broncos | Fri, Dec 25 4:30 PM ET |
| Jan 3, 2027 | Buffalo Bills @ Miami Dolphins | Sun, Jan 3 1:00 PM ET |
| Jan 10, 2027 | Buffalo Bills vs New York Jets | Sun, Jan 10 12:00 AM ET |
Roster
| Player | No | Pos | Status | Height | Weight | Experience | College |
|---|---|---|---|---|---|---|---|
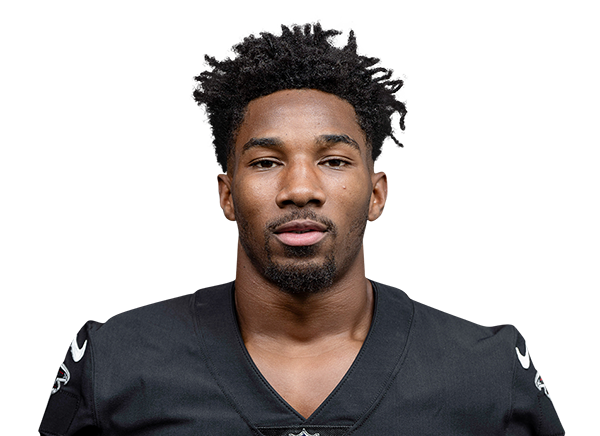 Dee Alford |
23 | CB | Active | 5' 11" | 180 lbs | 5 | Tusculum |
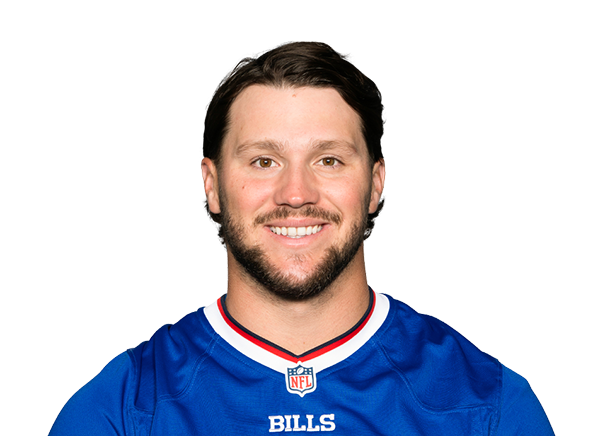 Josh Allen |
17 | QB | Active | 6' 5" | 237 lbs | 9 | Wyoming |
 Kyle Allen |
11 | QB | Active | 6' 3" | 210 lbs | 8 | Houston |
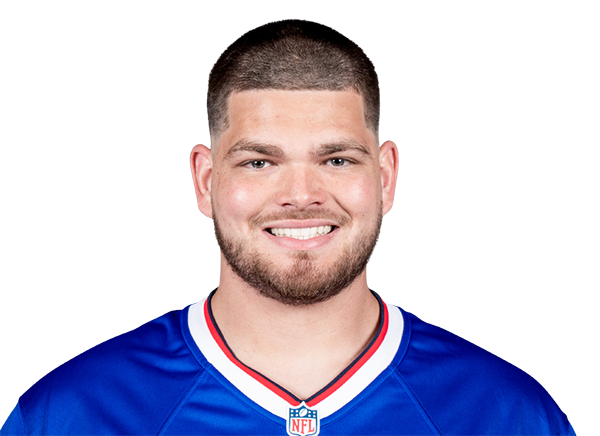 Alec Anderson |
70 | OT | Active | 6' 5" | 305 lbs | 4 | UCLA |
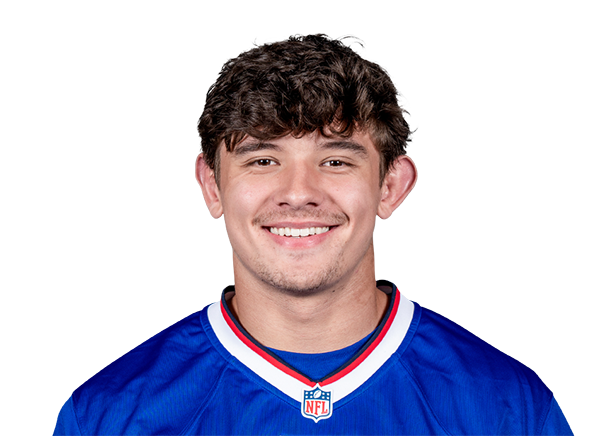 Joe Andreessen |
44 | LB | Active | 6' 1" | 240 lbs | 3 | Buffalo |
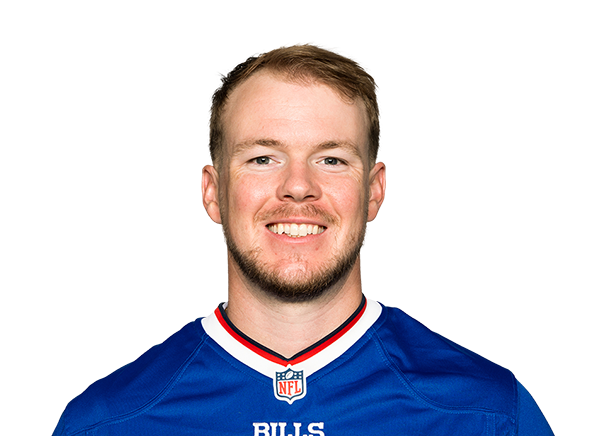 Tyler Bass |
16 | PK | Active | 5' 10" | 183 lbs | 7 | Georgia Southern |
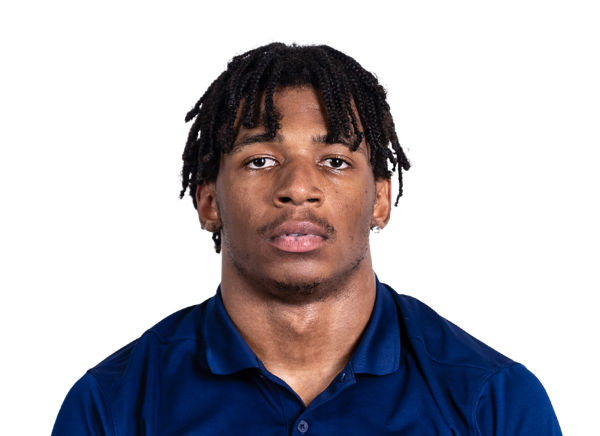 Skyler Bell |
13 | WR | Active | 5' 11" | 192 lbs | R | UConn |
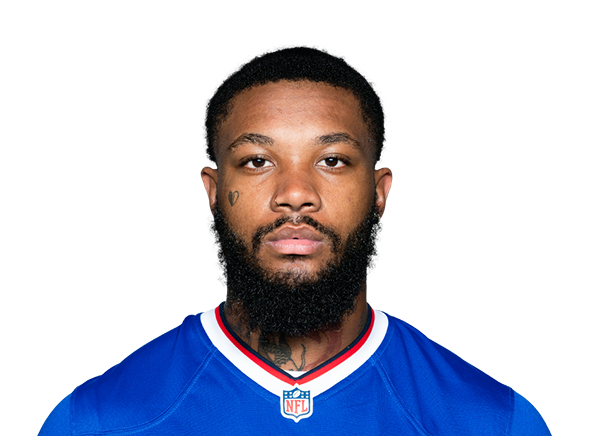 Christian Benford |
47 | CB | Active | 6' 1" | 205 lbs | 5 | Villanova |
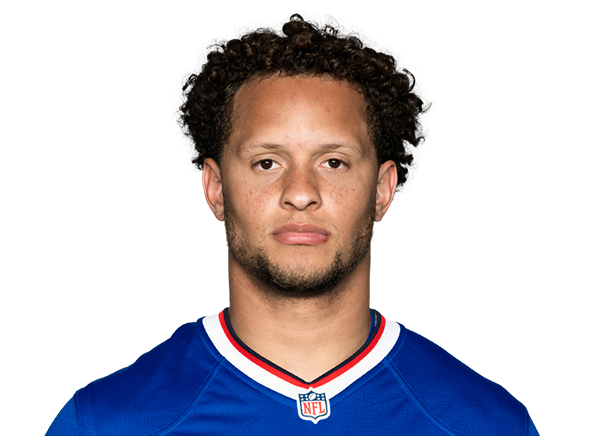 Terrel Bernard |
8 | LB | Active | 6' 1" | 224 lbs | 5 | Baylor |
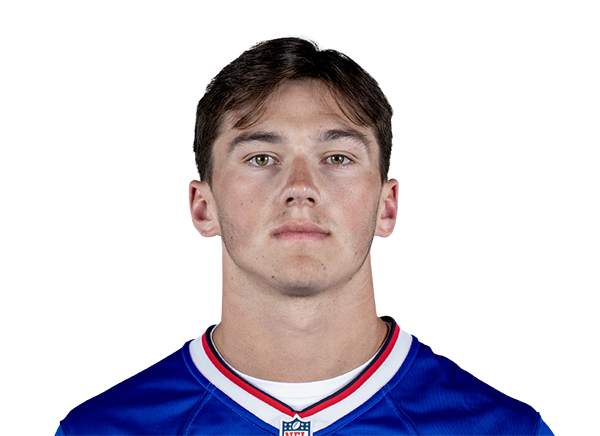 Cole Bishop |
24 | S | Active | 6' 2" | 206 lbs | 2 | Utah |
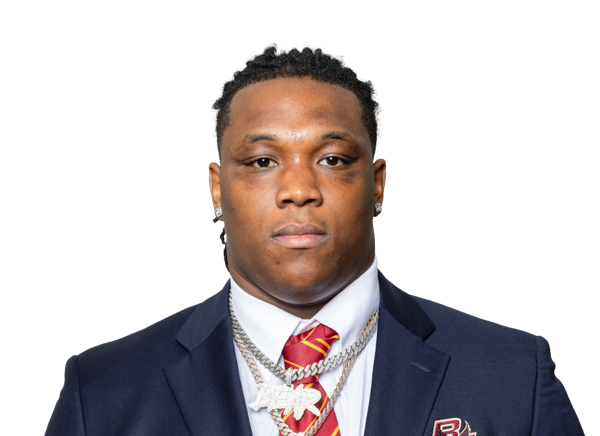 Jude Bowry |
74 | OT | Active | 6' 5" | 314 lbs | R | Boston College |
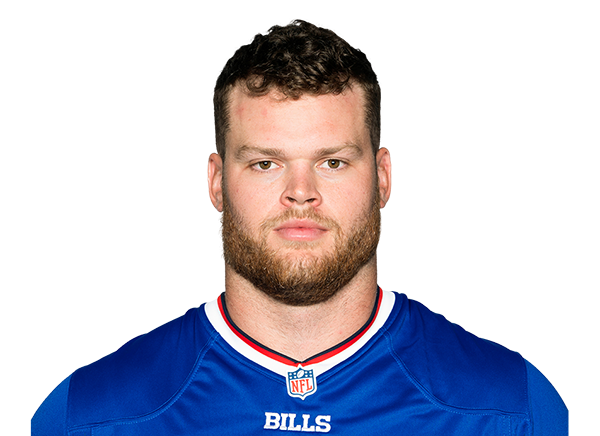 Spencer Brown |
79 | OT | Active | 6' 8" | 311 lbs | 6 | Northern Iowa |
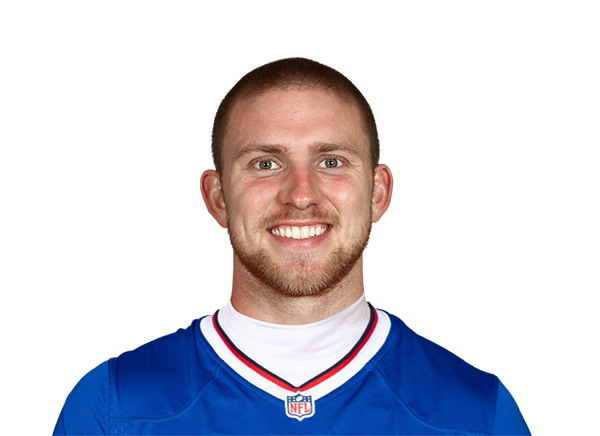 Shane Buechele |
6 | QB | Practice Squad | 6' 0" | 210 lbs | 4 | SMU |
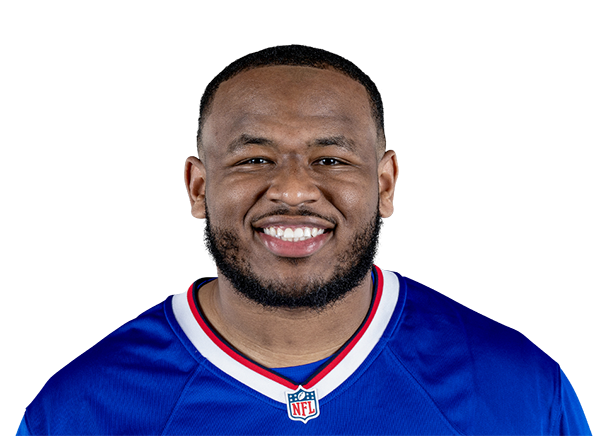 DeWayne Carter |
90 | DT | Active | 6' 2" | 302 lbs | 3 | Duke |
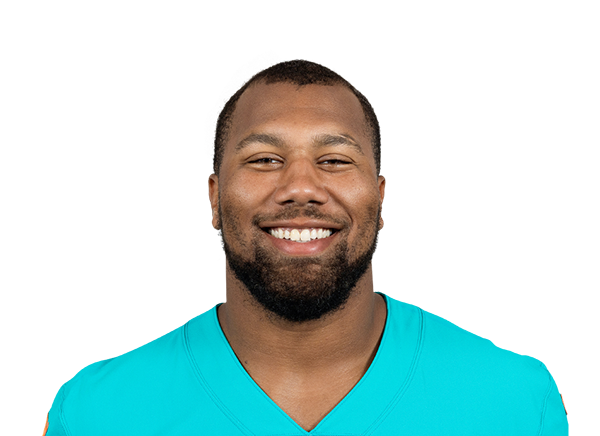 Bradley Chubb |
9 | LB | Active | 6' 4" | 268 lbs | 9 | NC State |
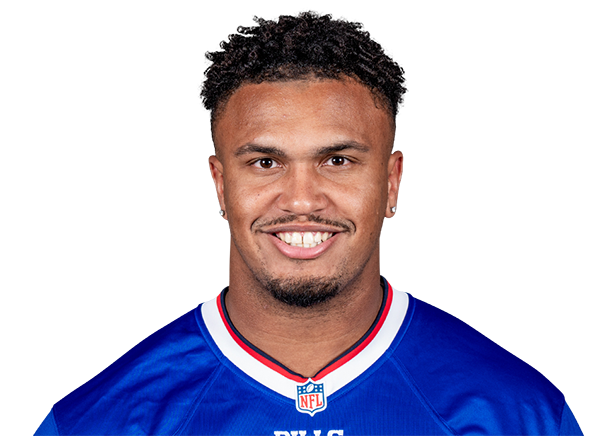 Travis Clayton |
67 | OT | Practice Squad | 6' 7" | 303 lbs | 2 | - |
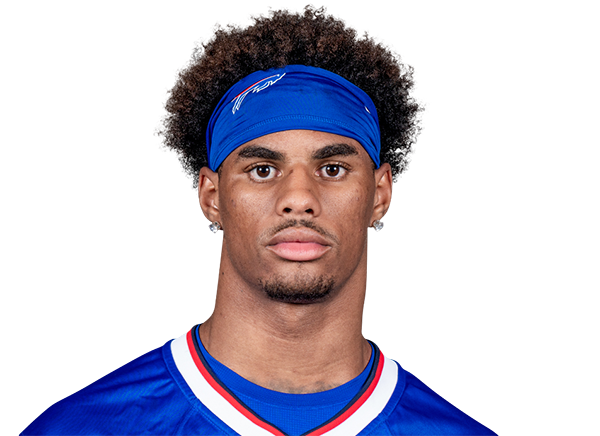 Keon Coleman |
0 | WR | Active | 6' 3" | 213 lbs | 3 | Florida State |
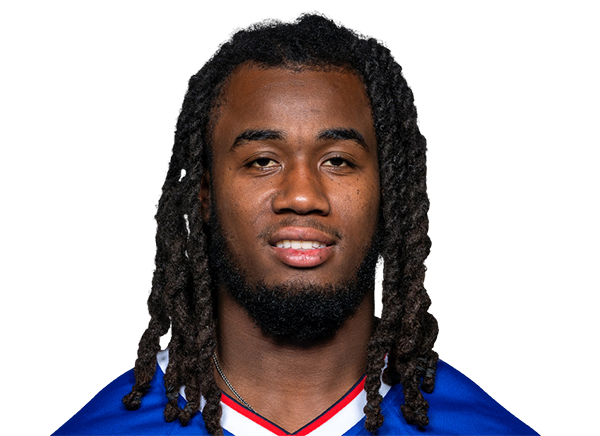 James Cook III |
4 | RB | Active | 5' 11" | 190 lbs | 5 | Georgia |
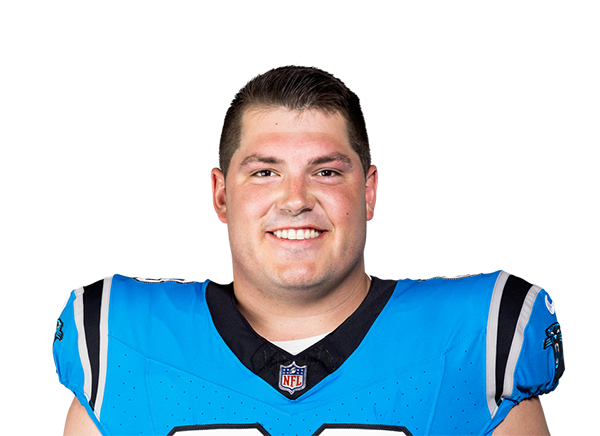 Austin Corbett |
63 | C | Active | 6' 4" | 306 lbs | 9 | Nevada |
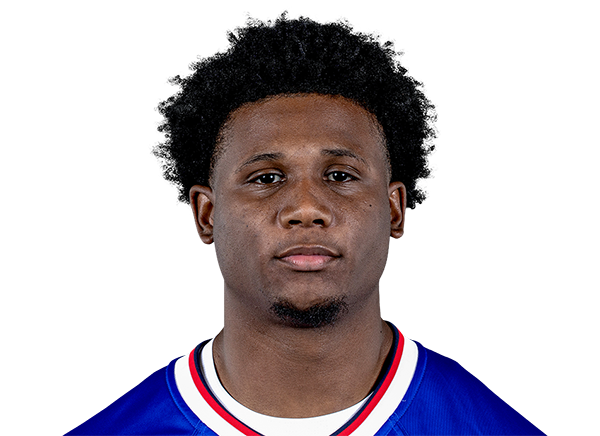 Te'Cory Couch |
33 | CB | Active | 5' 10" | 185 lbs | 1 | Miami |
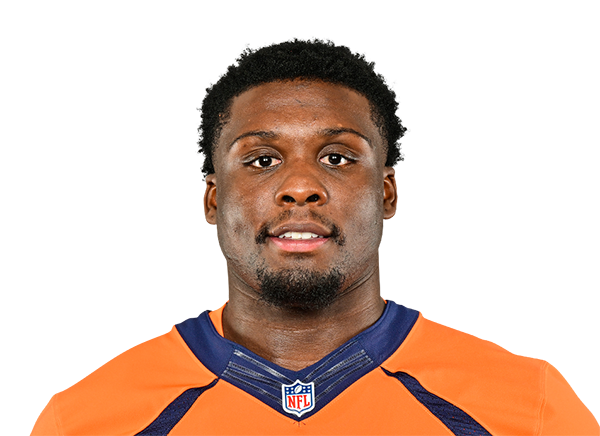 Lloyd Cushenberry III |
53 | C | Active | 6' 4" | 315 lbs | 7 | LSU |
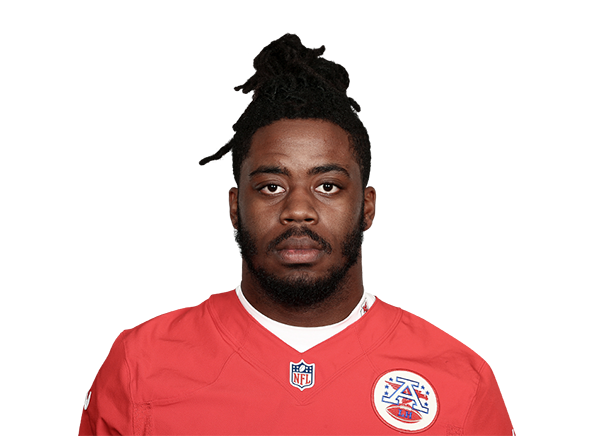 Mike Danna |
51 | DE | Active | 6' 2" | 261 lbs | 6 | Michigan |
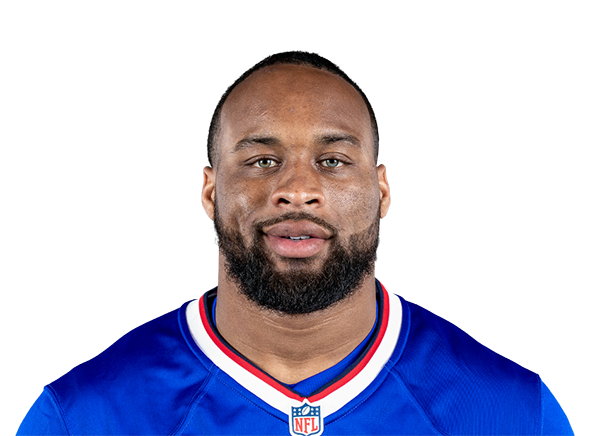 Ray Davis |
7 | RB | Active | 5' 8" | 211 lbs | 3 | Kentucky |
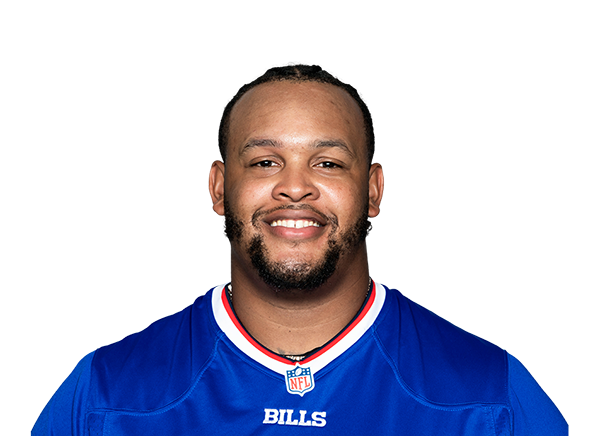 Dion Dawkins |
73 | OT | Active | 6' 5" | 320 lbs | 10 | Temple |
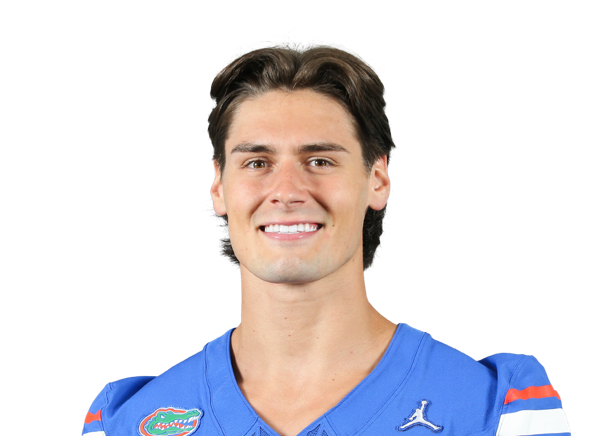 Tommy Doman Jr. |
39 | P | Active | 6' 4" | 214 lbs | R | Florida |
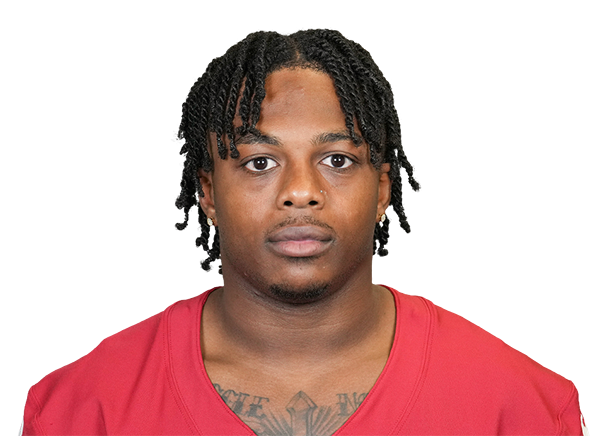 Greg Dortch |
19 | WR | Active | 5' 7" | 183 lbs | 6 | Wake Forest |
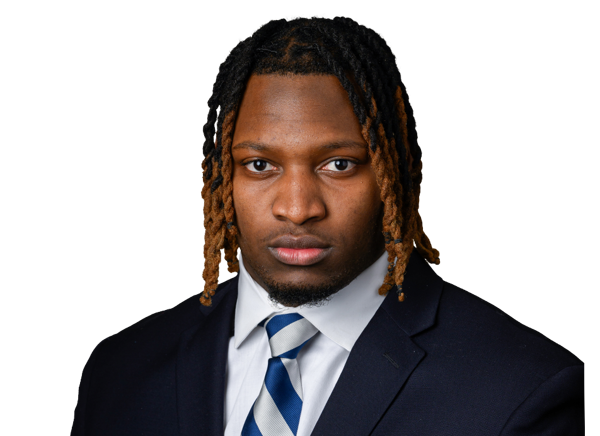 Zane Durant |
92 | DT | Day-To-Day | 6' 1" | 290 lbs | R | Penn State |
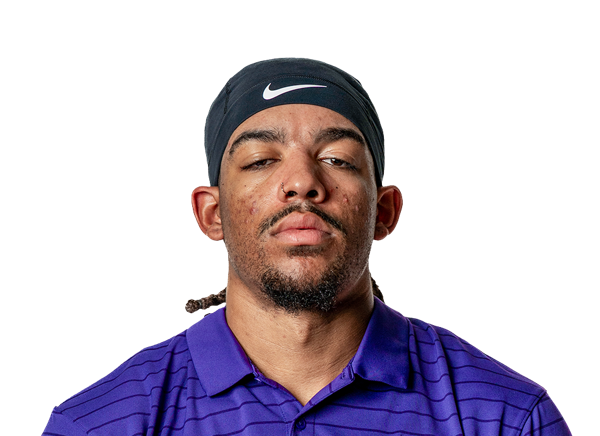 Kaleb Elarms-Orr |
52 | LB | Active | 6' 2" | 234 lbs | R | TCU |
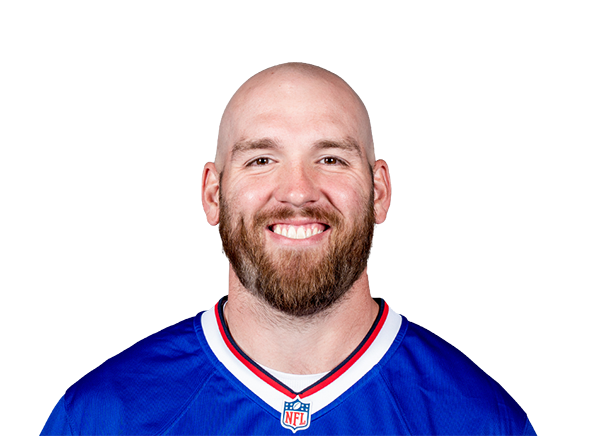 Reid Ferguson |
69 | LS | Active | 6' 2" | 235 lbs | 10 | LSU |
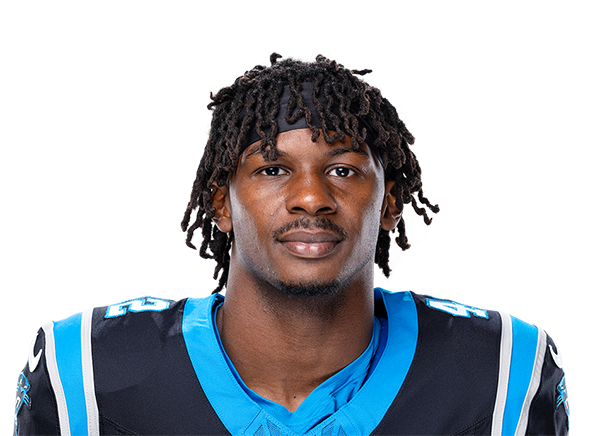 Sam Franklin Jr. |
28 | S | News | 6' 3" | 210 lbs | 7 | Temple |
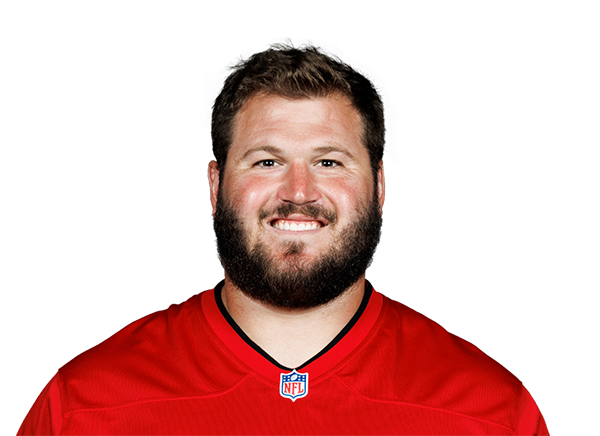 Greg Gaines |
97 | DT | Active | 6' 1" | 312 lbs | 7 | Washington |
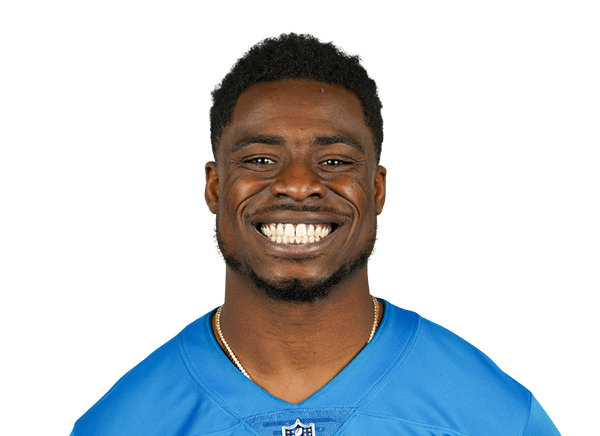 C.J. Gardner-Johnson |
22 | S | Active | 5' 11" | 208 lbs | 8 | Florida |
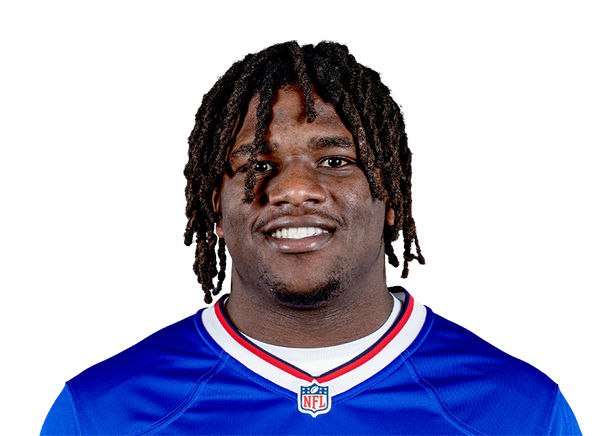 Frank Gore Jr. |
20 | RB | Practice Squad | 5' 8" | 201 lbs | 1 | Southern Miss |
 Stephen Gosnell |
89 | WR | Practice Squad | 6' 1" | 198 lbs | 1 | Virginia Tech |
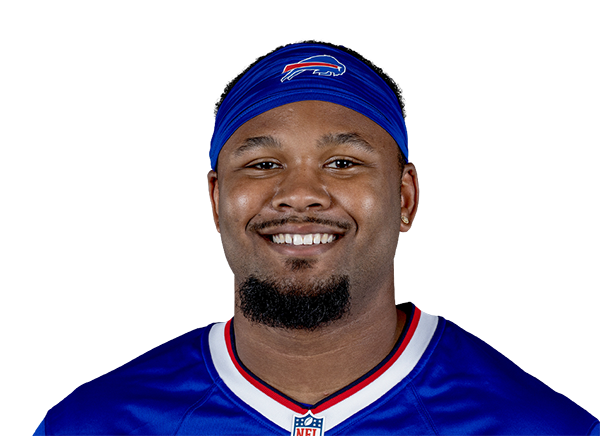 Tylan Grable |
68 | OT | Active | 6' 5" | 313 lbs | 3 | UCF |
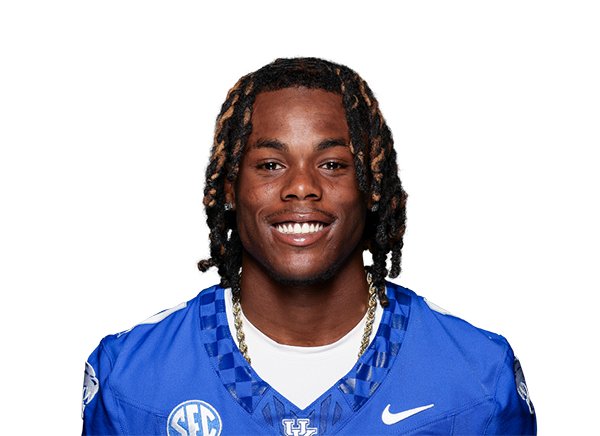 Maxwell Hairston |
1 | CB | Active | 5' 11" | 192 lbs | 2 | Kentucky |
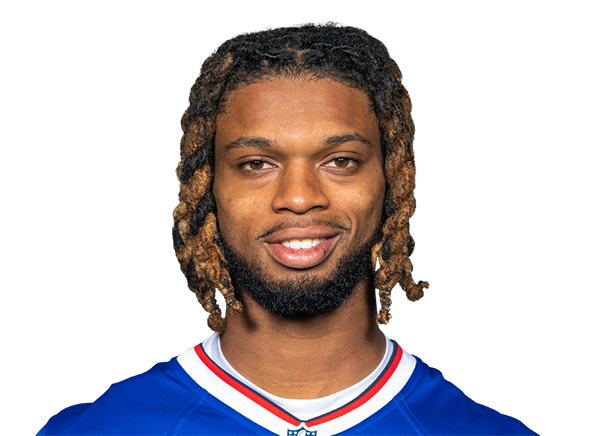 Damar Hamlin |
3 | S | Active | 6' 0" | 200 lbs | 6 | Pittsburgh |
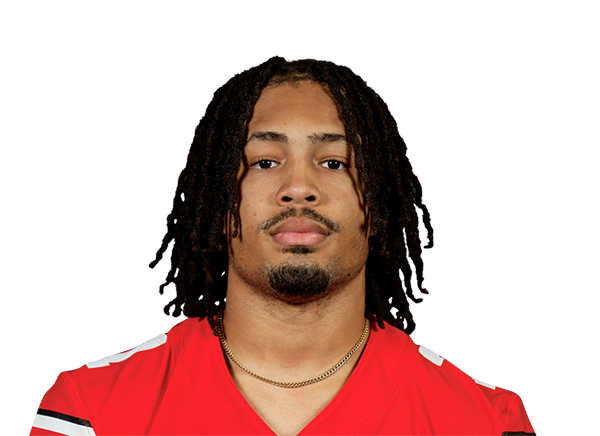 Jordan Hancock |
37 | CB | Day-To-Day | 6' 0" | 195 lbs | 2 | Ohio State |
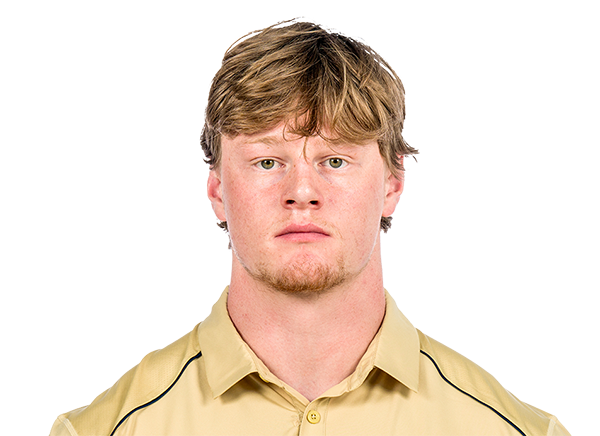 Jackson Hawes |
85 | TE | Active | 6' 4" | 253 lbs | 2 | Georgia Tech |
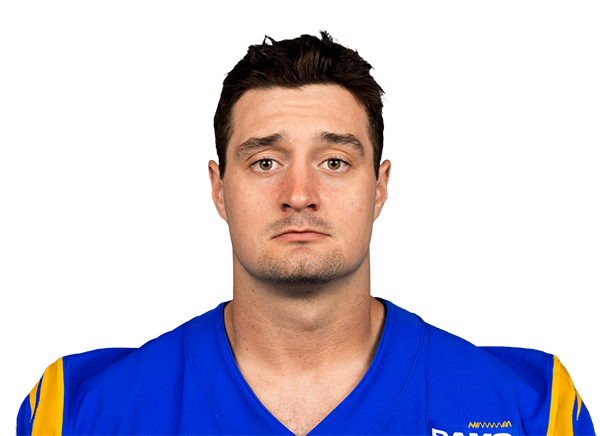 Michael Hoecht |
55 | DE | Active | 6' 4" | 264 lbs | 6 | Brown |
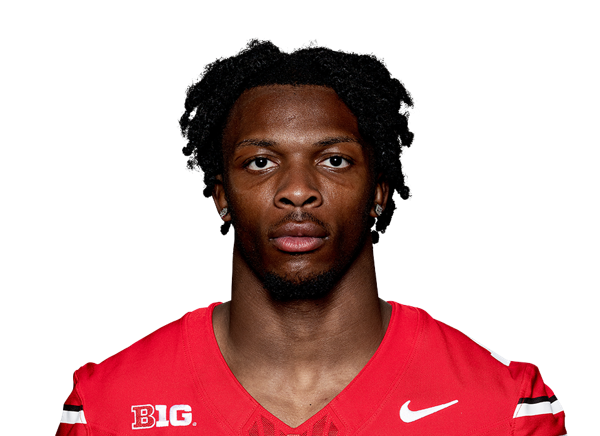 Davison Igbinosun |
21 | CB | Active | 6' 2" | 193 lbs | R | Ohio State |
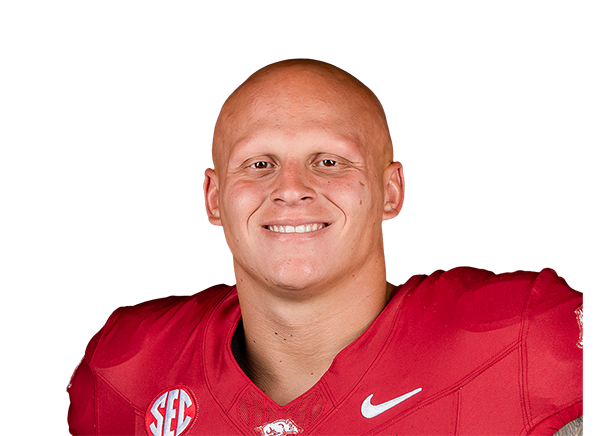 Landon Jackson |
94 | DE | Active | 6' 6" | 264 lbs | 2 | Arkansas |
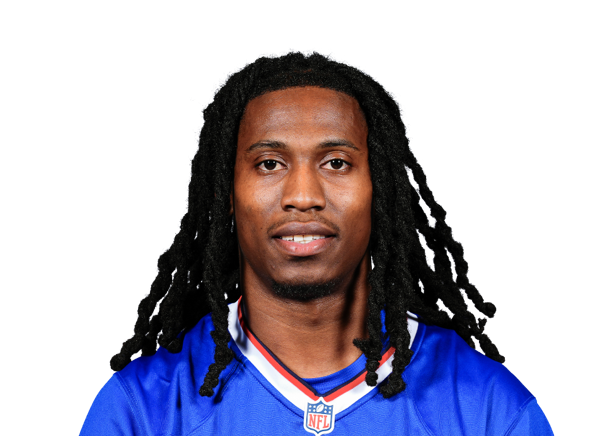 Keonta Jenkins |
49 | LB | Practice Squad | 6' 2" | 225 lbs | 1 | Virginia Tech |
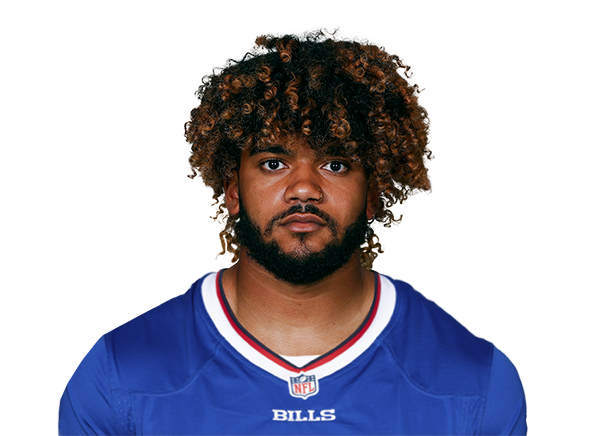 Ty Johnson |
26 | RB | Active | 5' 10" | 210 lbs | 8 | Maryland |
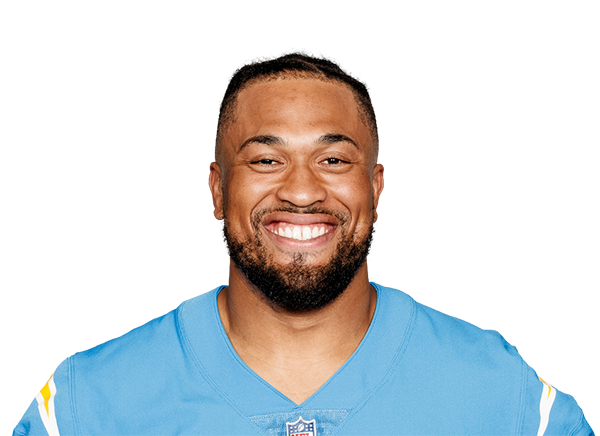 Austin Johnson |
93 | DT | Practice Squad | 6' 4" | 314 lbs | 10 | Penn State |
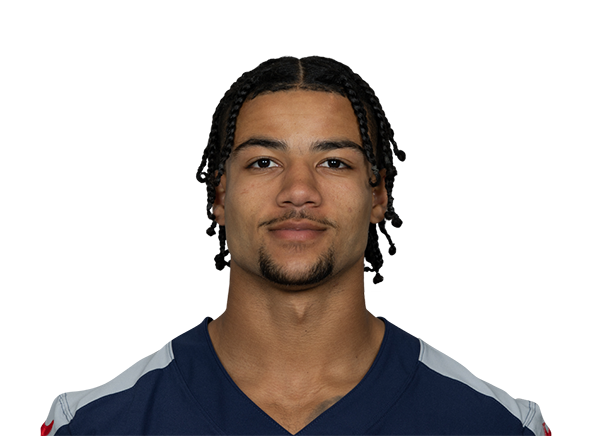 Anthony Kendall |
30 | CB | Practice Squad | 5' 10" | 188 lbs | 3 | Baldwin Wallace |
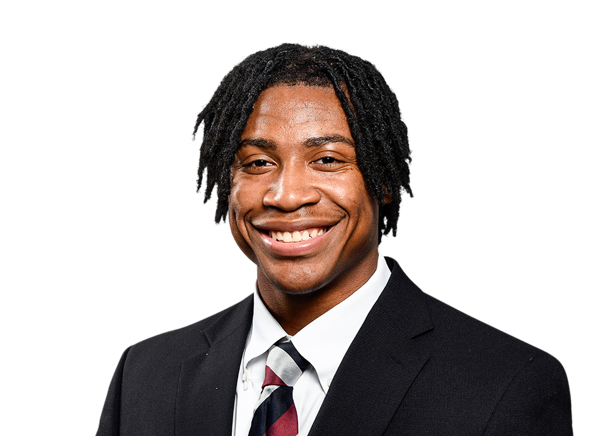 Jalon Kilgore |
29 | S | Active | 6' 1" | 210 lbs | R | South Carolina |
 Dalton Kincaid |
86 | TE | Active | 6' 3" | 246 lbs | 4 | Utah |
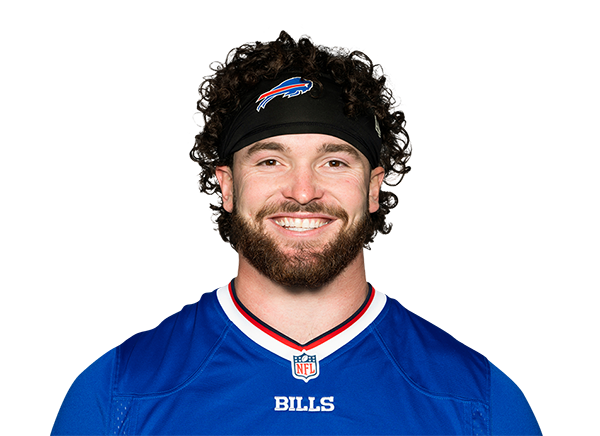 Dawson Knox |
88 | TE | Active | 6' 4" | 254 lbs | 8 | Ole Miss |
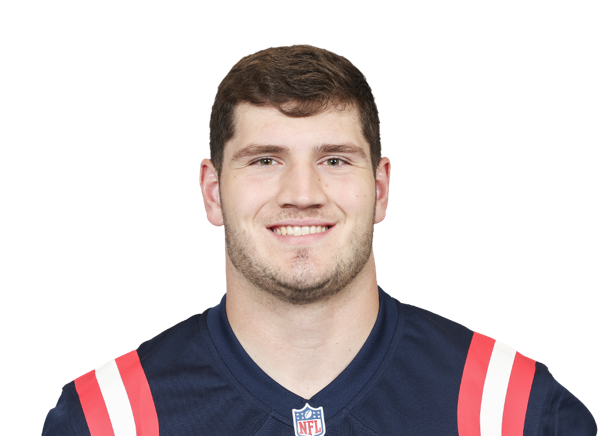 Brock Lampe |
- | FB | Practice Squad | 6' 1" | 249 lbs | 1 | Northern Illinois |
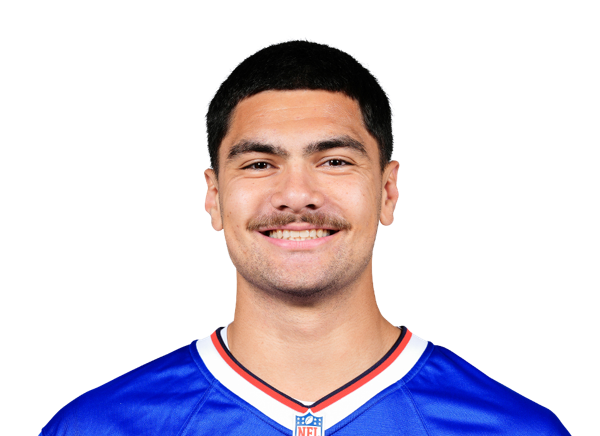 Keleki Latu |
83 | TE | Active | 6' 6" | 249 lbs | 1 | Washington |
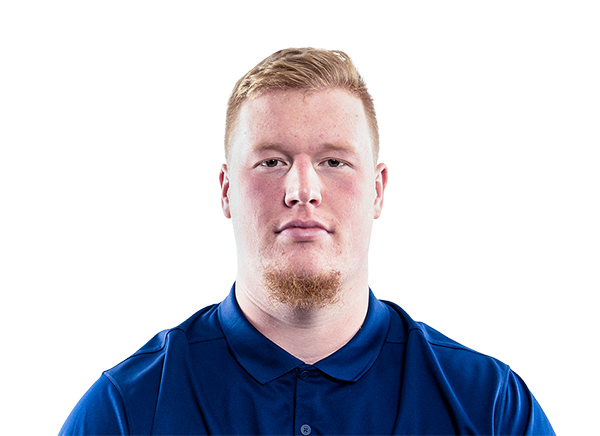 Chase Lundt |
77 | OT | Practice Squad | 6' 7" | 304 lbs | 2 | UConn |
 Ja'Mori Maclin |
84 | WR | Practice Squad | 5' 10" | 183 lbs | R | Kentucky |
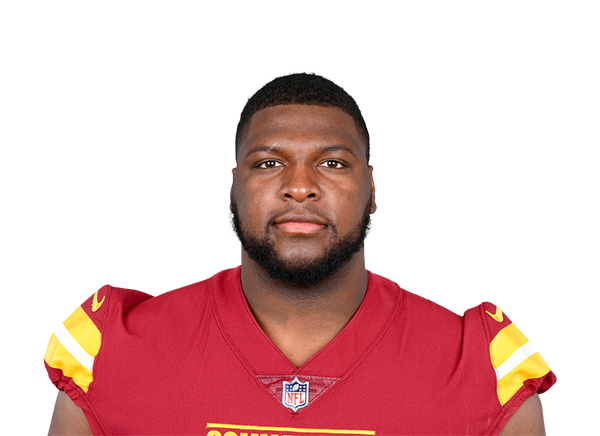 Phidarian Mathis |
72 | DT | Practice Squad | 6' 4" | 312 lbs | 5 | Alabama |
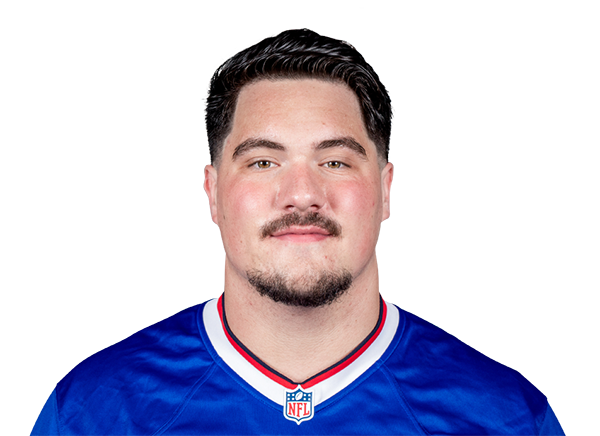 Connor McGovern |
66 | C | Active | 6' 6" | 318 lbs | 8 | Penn State |
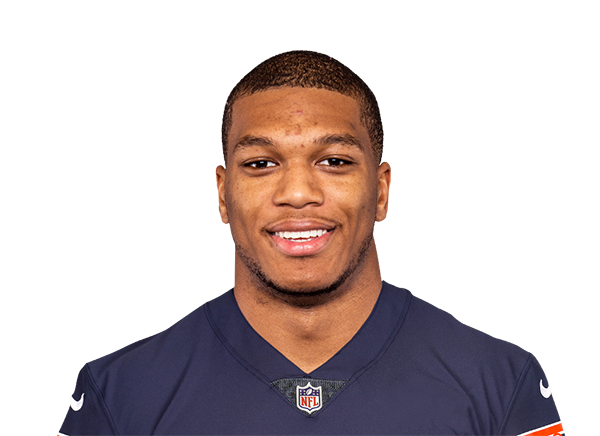 DJ Moore |
2 | WR | Active | 6' 0" | 213 lbs | 9 | Maryland |
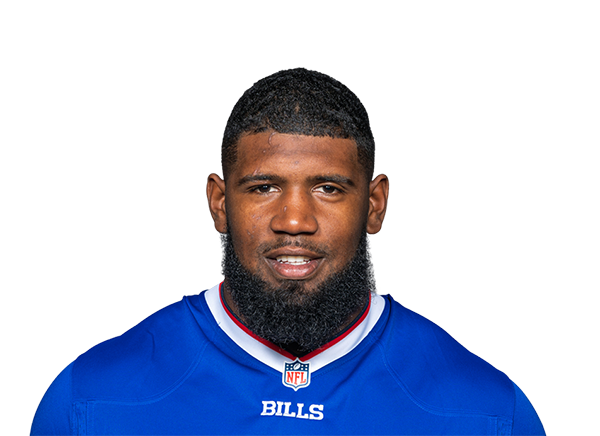 Ed Oliver |
91 | DT | Active | 6' 1" | 287 lbs | 8 | Houston |
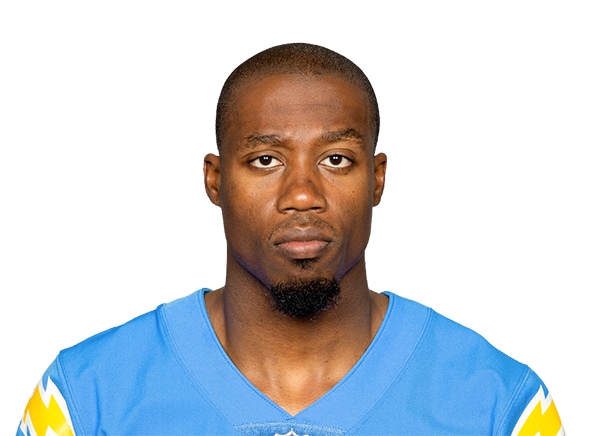 Joshua Palmer |
5 | WR | Active | 6' 1" | 210 lbs | 6 | Tennessee |
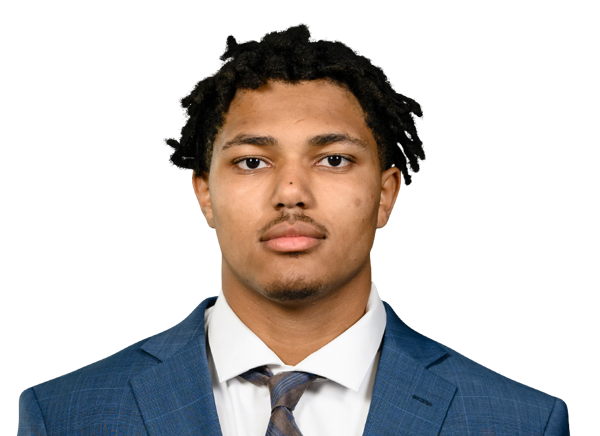 TJ Parker |
99 | LB | Active | 6' 3" | 263 lbs | R | Clemson |
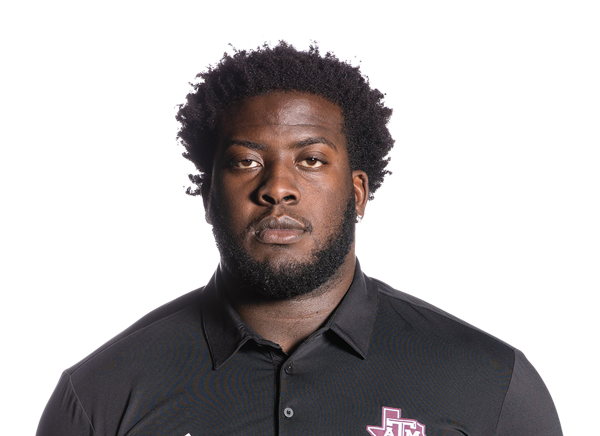 Ar'maj Reed-Adams |
60 | G | Active | 6' 5" | 314 lbs | R | Texas A&M |
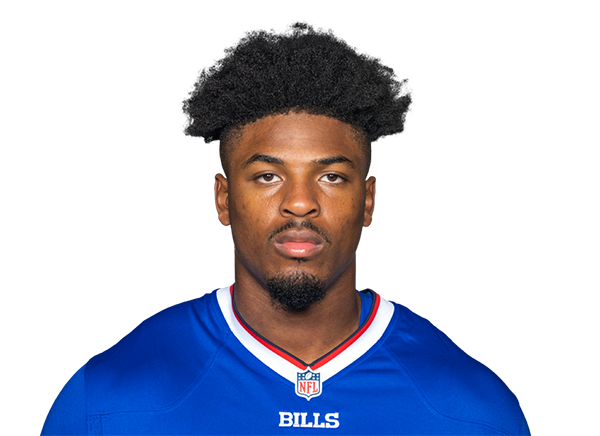 Greg Rousseau |
15 | LB | Active | 6' 6" | 266 lbs | 6 | Miami |
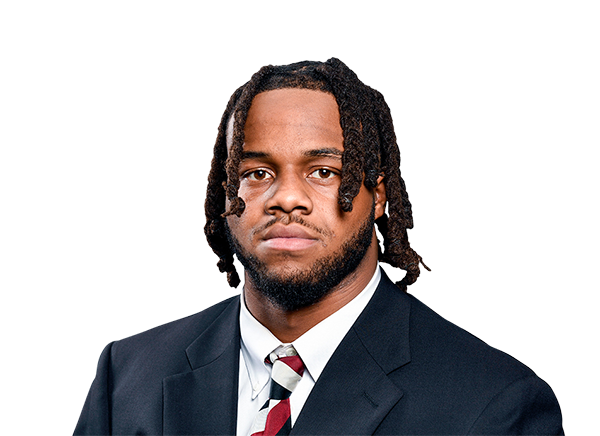 T.J. Sanders |
98 | DT | Active | 6' 4" | 297 lbs | 2 | South Carolina |
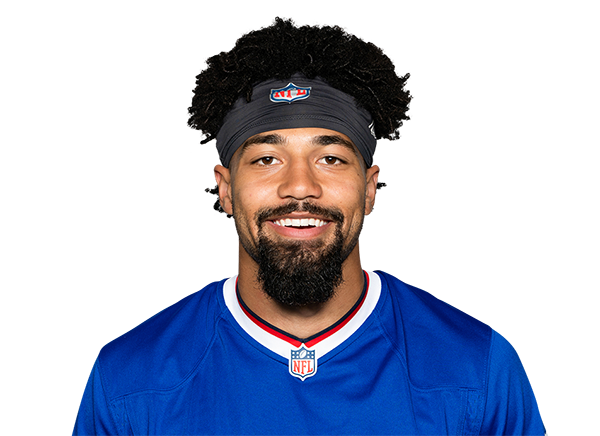 Khalil Shakir |
10 | WR | Active | 6' 0" | 190 lbs | 5 | Boise State |
 Tyrell Shavers |
14 | WR | Day-To-Day | 6' 4" | 211 lbs | 2 | San Diego State |
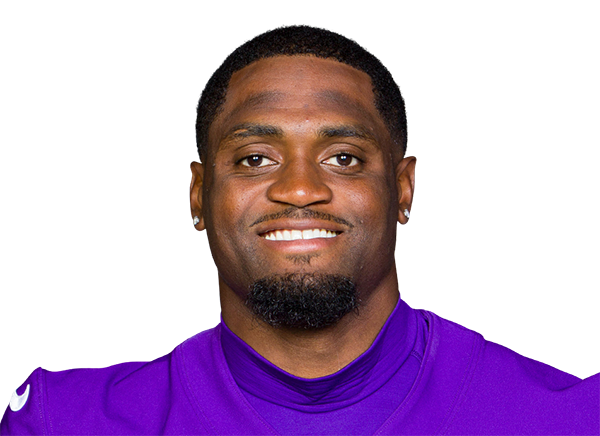 Trent Sherfield |
81 | WR | Practice Squad | 6' 0" | 203 lbs | 9 | Vanderbilt |
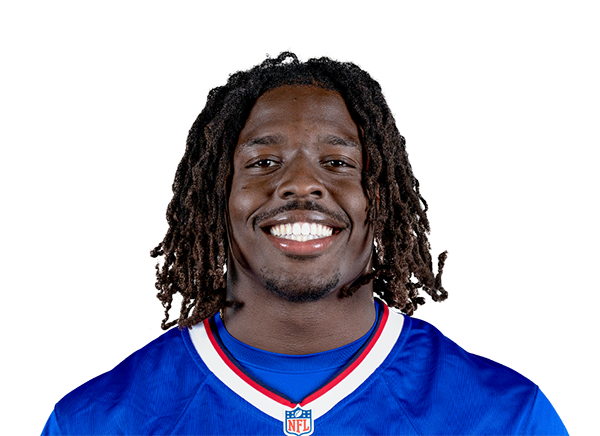 Javon Solomon |
56 | LB | Active | 6' 1" | 246 lbs | 3 | Troy |
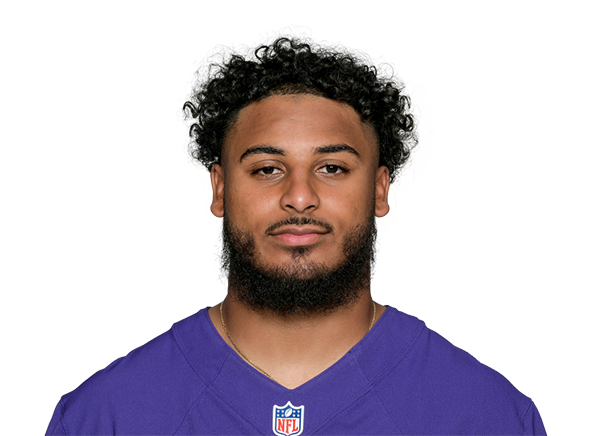 Geno Stone |
25 | S | Practice Squad | 5' 11" | 210 lbs | 7 | Iowa |
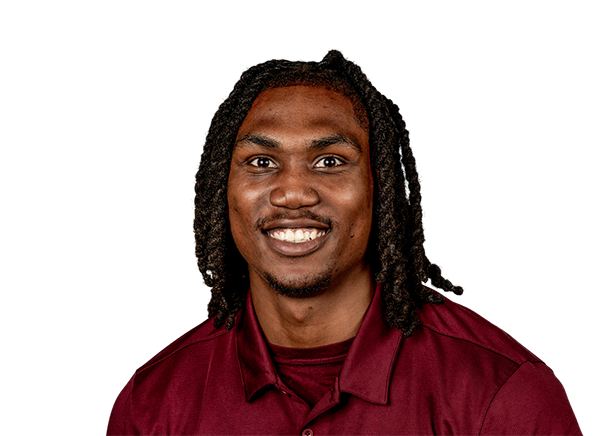 Dorian Strong |
43 | CB | Day-To-Day | 6' 1" | 185 lbs | 2 | Virginia Tech |
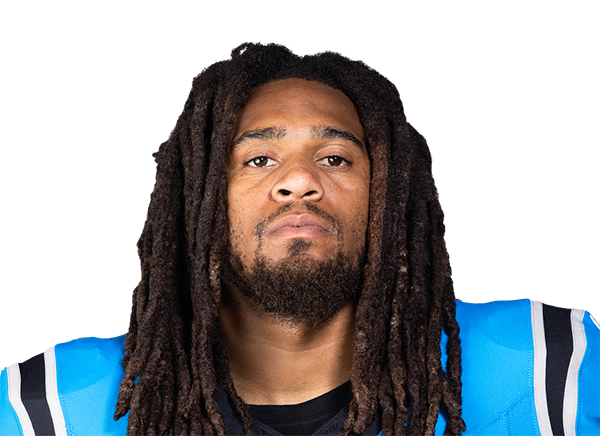 Shaq Thompson |
45 | LB | Practice Squad | 6' 0" | 230 lbs | 11 | Washington |
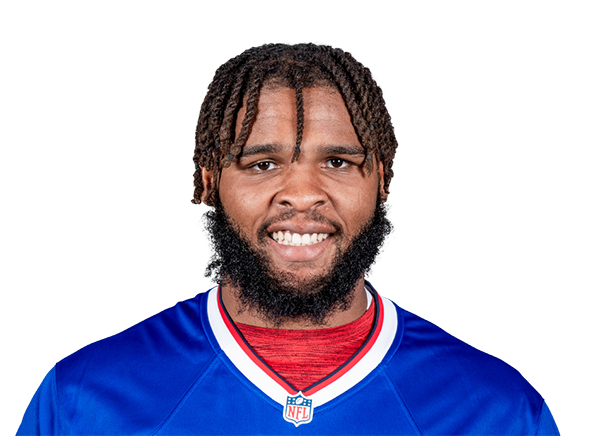 O'Cyrus Torrence |
64 | G | Active | 6' 5" | 330 lbs | 4 | Florida |
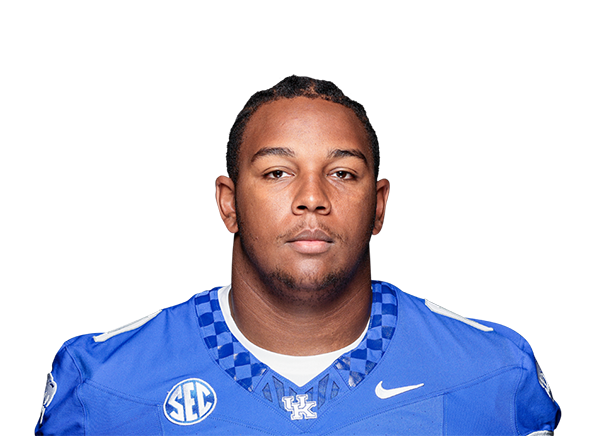 Deone Walker |
96 | DT | Active | 6' 7" | 331 lbs | 2 | Kentucky |
 Kani Walker |
41 | CB | Active | 6' 2" | 204 lbs | R | Arkansas |
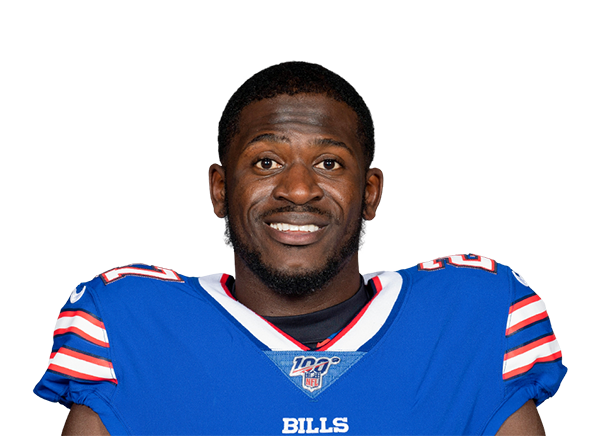 Tre'Davious White |
27 | CB | Practice Squad | 5' 11" | 192 lbs | 9 | LSU |
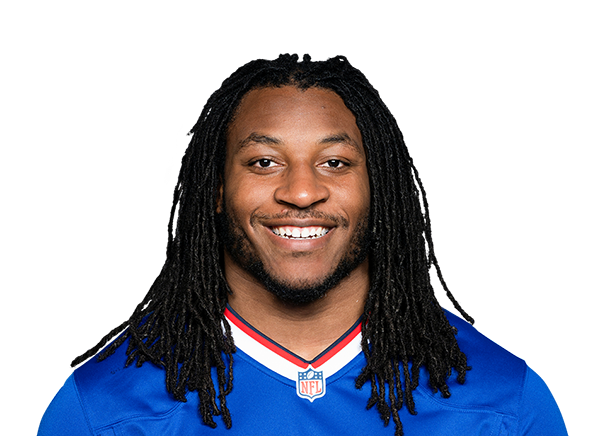 Dorian Williams |
42 | LB | Active | 6' 1" | 228 lbs | 4 | Tulane |
Buffalo Bills — Stats
Team Scoring
| Wins | 5 |
| Losses | 1 |
| Ties | 0 |
| Win % | 0.8333333 |
| Points For | 197 |
| Points Against | 171 |
| Point Differential | 26 |
| Streak | 2 |
| Division Record | 0 |
Passing
| Completion Percentage | 66.7 |
| Completions | 114 |
| Interception Percentage | 2.30 |
| Interceptions | 4 |
| Longest Pass | 57 |
| Net Passing Yards | 1,433 |
| Net Passing Yards Per Game | 238.8 |
| Passing Attempts | 171 |
| Passing Touchdown % | 5.30 |
| Passing Touchdowns | 9 |
| Passer Rating | 102.1 |
| Total Sacks | 12 |
| Sack Yards Lost | 71 |
| Yards Per Pass Attempt | 8.8 |
| Passing Yards | 1,504 |
| Passing Fumbles Lost | 2 |
| Team Games Played | 6 |
| Yards Per Game | 399.5 |
| Total Points Per Game | 32.8 |
| Total Points | 197 |
| Total Touchdowns | 23 |
| Passing Yards Per Game | 250.7 |
| Comp-Att | 114-171 |
| Sacks-Yards Lost | 12-71 |
Rushing
| Rushing Attempts | 176 |
| Rushing Yards | 893 |
| Yards Per Rush Attempt | 5.1 |
| Long Rushing | 35 |
| 20+ Yard Rushing Plays | 7 |
| Rushing Touchdowns | 14 |
| Rushing Yards Per Game | 148.8 |
| Rushing Fumbles | 4 |
| Rushing Fumbles Lost | 2 |
| Rushing 1st downs | 59 |
| Team Games Played | 6 |
| Total Yards | 2,397 |
| Total Offensive Plays | 359 |
| Total Points Per Game | 32.8 |
| Total Points | 197 |
| Total Touchdowns | 23 |
Receiving
| Receptions | 114 |
| Receiving Targets | 160 |
| Receiving Yards | 1,504 |
| Receiving Yards | 1,504 |
| Receiving Touchdowns | 9 |
| Long Reception | 57 |
| 20+ Yard Receiving Plays | 25 |
| Receiving Yards Per Game | 250.7 |
| Receiving Fumbles | 2 |
| Receiving Fumbles Lost | 2 |
| Receiving Yards After Catch | 811 |
| Receiving First Downs | 66 |
| Team Games Played | 6 |
| Yards Per Reception | 13.2 |
| Total Points Per Game | 32.8 |
| Total Points | 197 |
| Total Touchdowns | 23 |
Miscellaneous
| Total 1st downs | 143 |
| Rushing 1st downs | 59 |
| Passing 1st downs | 66 |
| 1st downs by penalty | 18 |
| Third Down Conversions | 30 |
| Third Down Attempts | 63 |
| 3rd down % | 47.62 |
| Fourth Down Conversions | 3 |
| First Downs Attempts | 4 |
| 4th down % | 75.00 |
| Total Penalties | 51 |
| Total Penalty Yards | 439 |
| Possession Time Seconds | 10461 |
| Red Zone Field Goal Percentage | 30.77 |
| Red Zone Scoring Percentage | 100.00 |
| Red Zone Efficiency Percentage | 82.42 |
| Red Zone Touchdown Percentage | 69.23 |
| Total Takeaways | 6 |
| Total Giveaways | 9 |
| Turnover Ratio | -3 |
| Fumbles Lost | 5 |
| 3rd down efficiency | 30-63 |
| 4th down efficiency | 3-4 |
| Total-Yards | 51-439 |
Defense
| Solo Tackles | 231 |
| Assist Tackles | 223 |
| Total Tackles | 454 |
| Sacks | 11 |
| Sack Yards | 77 |
| Stuffs | 34 |
| Passes Defended | 36 |
| Average Interception Yards | 26.0 |
| Long Interception | 41 |
| Miscellaneous Touchdowns | 0 |
| Kicks Blocked | 1 |
| Tackles For Loss | 28 |
| Team Games Played | 6 |
Defensive Interceptions
| Interceptions | 3 |
| Interception Yards | 78 |
| Interception Touchdowns | 0 |
| INT: Total | 3-78 |
General
| Fumbles | 10 |
| Forced Fumbles | 4 |
| Fumbles Recovered | 3 |
| Fumbles Touchdowns | 0 |
| Games Played | 6 |
| Fumbles-Lost | 10-5 |
Returning
| Kick Returns | 29 |
| Kick Return Yards | 789 |
| Yards Per Kick Return | 27.2 |
| Long Kick Return | 70 |
| Kick Return Touchdowns | 0 |
| Punt Returns | 12 |
| Punt Return Yards | 121 |
| Yards Per Punt Return | 10.1 |
| Long Punt Return | 25 |
| Punt Return Touchdowns | 0 |
| Punt Return Fair Catches | 2 |
| Kick Return Fumbles Lost | 0 |
| Punt Return Fumbles Lost | 0 |
| Team Games Played | 6 |
| Punt: Total | 12-121 |
Kicking
| Field Goal Made | 13 |
| Field Goal Attempts | 13 |
| Field Goal Percentage | 100.0 |
| Long Field Goal Made | 49 |
| Field Goal Attempts 1-19 | 0 |
| Field Goal Attempts 20-29 | 4 |
| Field Goal Attempts 30-39 | 4 |
| Field Goal Attempts 40-49 | 5 |
| Field Goal Attempts 50+ | 0 |
| Extra Points Made | 18 |
| Extra Point Attempts | 20 |
| Extra Point Percentage | 90.0 |
| Field Goals Made 1-19 | 0 |
| Field Goals Made 20-29 | 4 |
| Field Goals Made 30-39 | 4 |
| Field Goals Made 40-49 | 5 |
| Field Goals Made 50+ | 0 |
| Total Kicking Points | 57 |
| Team Games Played | 6 |
| Touchback Percentage | 7 |
| Average Kickoff Return Yards | 26.1 |
| Kickoff Return Yards | 966 |
| Kickoff Returns | 37 |
| Kickoffs: Total | 37-966 |
| FG: Good-Attempts | 13-13 |
Punting
| Punts | 12 |
| Punt Yards | 584 |
| Long Punt | 63 |
| Gross Average Punt Yards | 48.7 |
| Net Average Punt Yards | 46.0 |
| Punts Blocked | 0 |
| Punts Inside 20 | 6 |
| Touchbacks | 0 |
| Fair Catches | 7 |
| Punt Returns | 3 |
| Punt Return Yards | 32 |
| Average Punt Return Yards | 10.7 |
| Team Games Played | 6 |
| Punt: Total Yards | 12-584 |
Scoring
| Rushing Touchdowns | 14 |
| Receiving Touchdowns | 9 |
| Return Touchdowns | 0 |
| Total Touchdowns | 23 |
| Field Goals | 13 |
| Kick Extra Points | 18 |
| Total Two Point Conversions | 1 |
| Total Points | 197 |
| Total Points Per Game | 32.8 |
Passing
| Completion Percentage | 64.9 |
| Completions | 157 |
| Interception Percentage | 1.24 |
| Interceptions | 3 |
| Longest Pass | 44 |
| Net Passing Yards | 1,715 |
| Net Passing Yards Per Game | 285.8 |
| Passing Attempts | 242 |
| Passing Touchdown % | 6.20 |
| Passing Touchdowns | 15 |
| Passer Rating | 102.5 |
| Total Sacks | 11 |
| Sack Yards Lost | 77 |
| Yards Per Pass Attempt | 7.4 |
| Passing Yards | 1,792 |
| Passing Fumbles Lost | 0 |
| Team Games Played | 6 |
| Yards Per Game | 399.7 |
| Total Points Per Game | 28.5 |
| Total Points | 171 |
| Total Touchdowns | 21 |
| Passing Yards Per Game | 298.7 |
| Comp-Att | 157-242 |
| Sacks-Yards Lost | 11-77 |
Rushing
| Rushing Attempts | 158 |
| Rushing Yards | 606 |
| Yards Per Rush Attempt | 3.8 |
| Long Rushing | 26 |
| 20+ Yard Rushing Plays | 1 |
| Rushing Touchdowns | 6 |
| Rushing Yards Per Game | 101.0 |
| Rushing Fumbles | 0 |
| Rushing Fumbles Lost | 0 |
| Rushing 1st downs | 38 |
| Team Games Played | 6 |
| Total Yards | 2,398 |
| Total Offensive Plays | 411 |
| Total Points Per Game | 28.5 |
| Total Points | 171 |
| Total Touchdowns | 21 |
Receiving
| Receptions | 157 |
| Receiving Targets | 237 |
| Receiving Yards | 1,792 |
| Receiving Yards | 1,792 |
| Receiving Touchdowns | 15 |
| Long Reception | 44 |
| 20+ Yard Receiving Plays | 26 |
| Receiving Yards Per Game | 298.7 |
| Receiving Fumbles | 0 |
| Receiving Fumbles Lost | 0 |
| Receiving Yards After Catch | 780 |
| Receiving First Downs | 95 |
| Team Games Played | 6 |
| Yards Per Reception | 11.4 |
| Total Points Per Game | 28.5 |
| Total Points | 171 |
| Total Touchdowns | 21 |
Miscellaneous
| Total 1st downs | 154 |
| Rushing 1st downs | 38 |
| Passing 1st downs | 95 |
| 1st downs by penalty | 21 |
| Third Down Conversions | 36 |
| Third Down Attempts | 80 |
| 3rd down % | 45.00 |
| Fourth Down Conversions | 8 |
| First Downs Attempts | 9 |
| 4th down % | 88.89 |
| Total Penalties | 48 |
| Total Penalty Yards | 395 |
| Possession Time Seconds | 11624 |
| Red Zone Field Goal Percentage | 26.92 |
| Red Zone Scoring Percentage | 96.15 |
| Red Zone Efficiency Percentage | 80.77 |
| Red Zone Touchdown Percentage | 69.23 |
| Total Takeaways | 9 |
| Total Giveaways | 6 |
| Turnover Ratio | 3 |
| Fumbles Lost | 3 |
| 3rd down efficiency | 36-80 |
| 4th down efficiency | 8-9 |
| Total-Yards | 48-395 |
Defense
| Solo Tackles | 222 |
| Assist Tackles | 172 |
| Total Tackles | 394 |
| Sacks | 12 |
| Sack Yards | 71 |
| Stuffs | 20 |
| Passes Defended | 19 |
| Average Interception Yards | 1.0 |
| Long Interception | 3 |
| Miscellaneous Touchdowns | 0 |
| Kicks Blocked | 0 |
| Tackles For Loss | 24 |
| Team Games Played | 6 |
Defensive Interceptions
| Interceptions | 4 |
| Interception Yards | 4 |
| Interception Touchdowns | 0 |
| INT: Total | 4-4 |
General
| Fumbles | 7 |
| Forced Fumbles | 8 |
| Fumbles Recovered | 5 |
| Fumbles Touchdowns | 0 |
| Games Played | 6 |
| Fumbles-Lost | 7-3 |
Returning
| Kick Returns | 37 |
| Kick Return Yards | 966 |
| Yards Per Kick Return | 26.1 |
| Long Kick Return | 34 |
| Kick Return Touchdowns | 0 |
| Punt Returns | 3 |
| Punt Return Yards | 32 |
| Yards Per Punt Return | 10.7 |
| Long Punt Return | 17 |
| Punt Return Touchdowns | 0 |
| Punt Return Fair Catches | 7 |
| Kick Return Fumbles Lost | 0 |
| Punt Return Fumbles Lost | 0 |
| Team Games Played | 6 |
| Punt: Total | 3-32 |
Kicking
| Field Goal Made | 8 |
| Field Goal Attempts | 11 |
| Field Goal Percentage | 72.7 |
| Long Field Goal Made | 58 |
| Field Goal Attempts 1-19 | 0 |
| Field Goal Attempts 20-29 | 3 |
| Field Goal Attempts 30-39 | 4 |
| Field Goal Attempts 40-49 | 2 |
| Field Goal Attempts 50+ | 2 |
| Extra Points Made | 19 |
| Extra Point Attempts | 19 |
| Extra Point Percentage | 100.0 |
| Field Goals Made 1-19 | 0 |
| Field Goals Made 20-29 | 3 |
| Field Goals Made 30-39 | 4 |
| Field Goals Made 40-49 | 0 |
| Field Goals Made 50+ | 1 |
| Total Kicking Points | 43 |
| Team Games Played | 6 |
| Touchback Percentage | 9 |
| Average Kickoff Return Yards | 27.2 |
| Kickoff Return Yards | 789 |
| Kickoff Returns | 29 |
| Kickoffs: Total | 29-789 |
| FG: Good-Attempts | 8-11 |
Punting
| Punts | 20 |
| Punt Yards | 1,026 |
| Long Punt | 62 |
| Gross Average Punt Yards | 51.3 |
| Net Average Punt Yards | 45.3 |
| Punts Blocked | 0 |
| Punts Inside 20 | 6 |
| Touchbacks | 3 |
| Fair Catches | 2 |
| Punt Returns | 12 |
| Punt Return Yards | 121 |
| Average Punt Return Yards | 10.1 |
| Team Games Played | 6 |
| Punt: Total Yards | 20-1,026 |
Scoring
| Rushing Touchdowns | 6 |
| Receiving Touchdowns | 15 |
| Return Touchdowns | 0 |
| Total Touchdowns | 21 |
| Field Goals | 8 |
| Kick Extra Points | 19 |
| Total Two Point Conversions | 1 |
| Total Points | 171 |
| Total Points Per Game | 28.5 |


