
Recent Results
| Date | Matchup | Result / Time |
|---|---|---|
| Oct 18, 2026 | Las Vegas Raiders vs Buffalo Bills | Sun, Oct 18 4:25 PM ET |
| Oct 11, 2026 | Las Vegas Raiders @ New England Patriots | Sun, Oct 11 1:00 PM ET |
| Oct 4, 2026 | Las Vegas Raiders vs Kansas City Chiefs | Sun, Oct 4 4:25 PM ET |
Upcoming Games
| Date | Matchup | Result / Time |
|---|---|---|
| Oct 25, 2026 | Las Vegas Raiders vs Los Angeles Rams | Sun, Oct 25 4:25 PM ET |
| Nov 1, 2026 | Las Vegas Raiders @ New York Jets | Sun, Nov 1 1:00 PM ET |
| Nov 8, 2026 | Las Vegas Raiders @ San Francisco 49ers | Sun, Nov 8 4:05 PM ET |

Las Vegas Raiders
3-3
🏟 Allegiant Stadium
Division Standings
| Team | W | L | T | PCT | DIV | PF | PA | STRK |
|---|---|---|---|---|---|---|---|---|
| Kansas City Chiefs | 5 | 0 | 0 | 1.000 | - | 140 | 83 | W5 |
| Buffalo Bills | 5 | 1 | 0 | .833 | - | 197 | 171 | W2 |
| Jacksonville Jaguars | 4 | 2 | 0 | .667 | - | 154 | 104 | L1 |
| Cleveland Browns | 4 | 2 | 0 | .667 | - | 106 | 122 | W1 |
| Denver Broncos | 4 | 2 | 0 | .667 | - | 114 | 125 | W2 |
| Pittsburgh Steelers | 4 | 2 | 0 | .667 | - | 137 | 128 | W2 |
| Baltimore Ravens | 4 | 2 | 0 | .667 | - | 156 | 132 | L1 |
| Cincinnati Bengals | 3 | 2 | 0 | .600 | - | 128 | 109 | W1 |
| New England Patriots | 4 | 3 | 0 | .571 | - | 160 | 143 | L1 |
| Las Vegas Raiders | 3 | 3 | 0 | .500 | - | 162 | 162 | L3 |
| New York Jets | 2 | 4 | 0 | .333 | - | 112 | 122 | L1 |
| Indianapolis Colts | 2 | 4 | 0 | .333 | - | 144 | 164 | L2 |
| Houston Texans | 2 | 4 | 0 | .333 | - | 144 | 143 | W2 |
| Tennessee Titans | 1 | 5 | 0 | .167 | - | 84 | 129 | W1 |
| Miami Dolphins | 0 | 5 | 0 | .000 | - | 70 | 132 | L5 |
| Los Angeles Chargers | 0 | 6 | 0 | .000 | - | 90 | 151 | L6 |
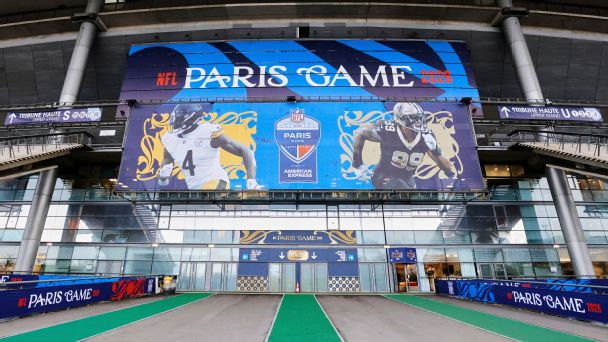
Week 7 NFL highlights: Best plays, moments, touchdowns, more
Check here for Sunday's top moments, starting with Aaron Rodgers, Jaylen Warren, Tyler Shough and Alvin Kamara in France.
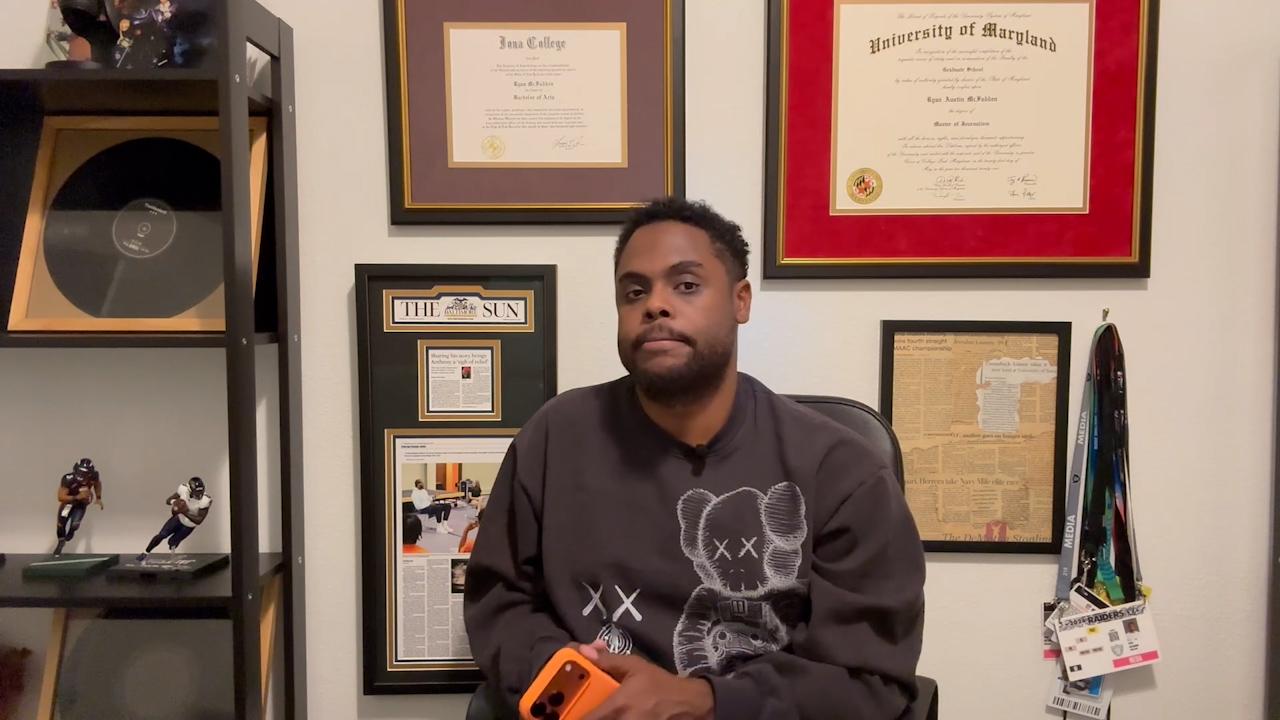
How come the Raiders' pass rush is so inconsistent?
Ryan McFadden breaks down the Raiders' inconsistent pass rush.
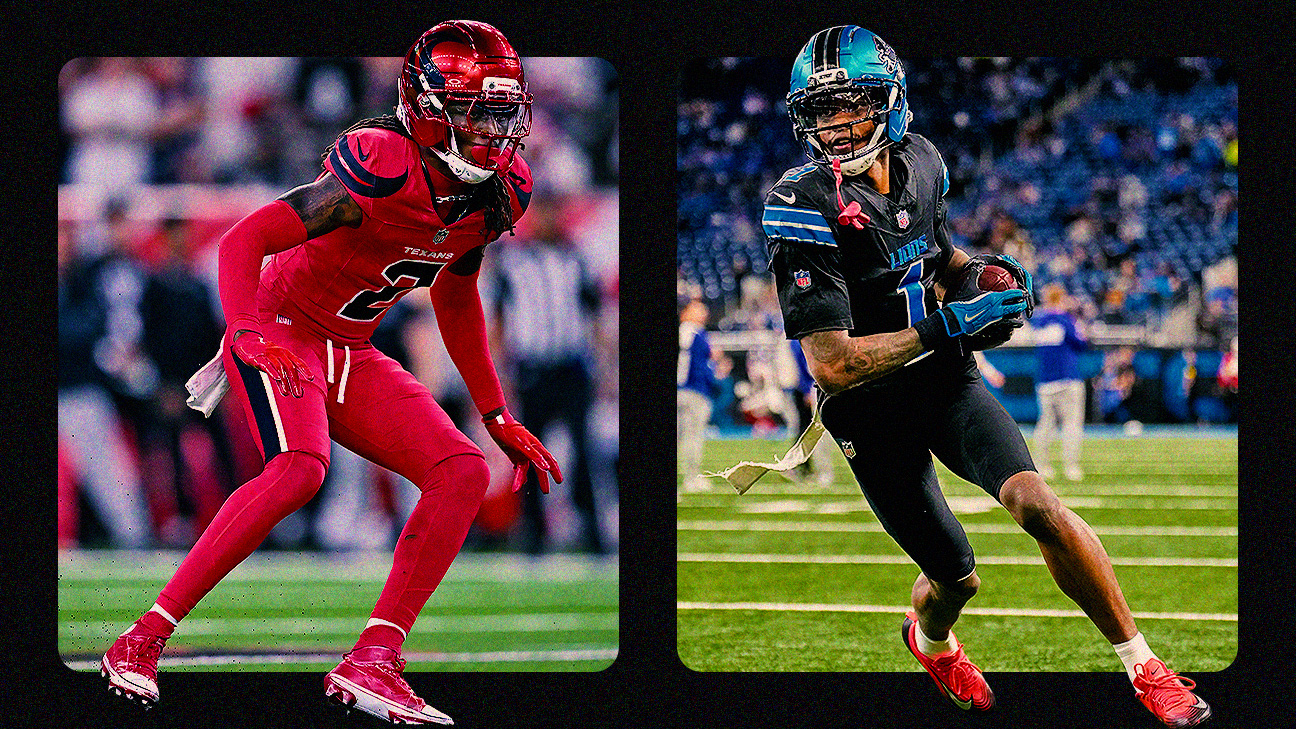
NFL Week 7 uniforms: Alternates galore as Texans go battle red, Lions all-black
Here's a look at what each NFL team is wearing in Week 7, led by alternate looks from Houston, Detroit and Dallas.

Fernando Mendoza is embracing being Raiders' latest Hispanic QB
The rookie's next chapter is inspired by the legacies of a Hispanic coach, QB and a Raiders' fan base embracing the culture.
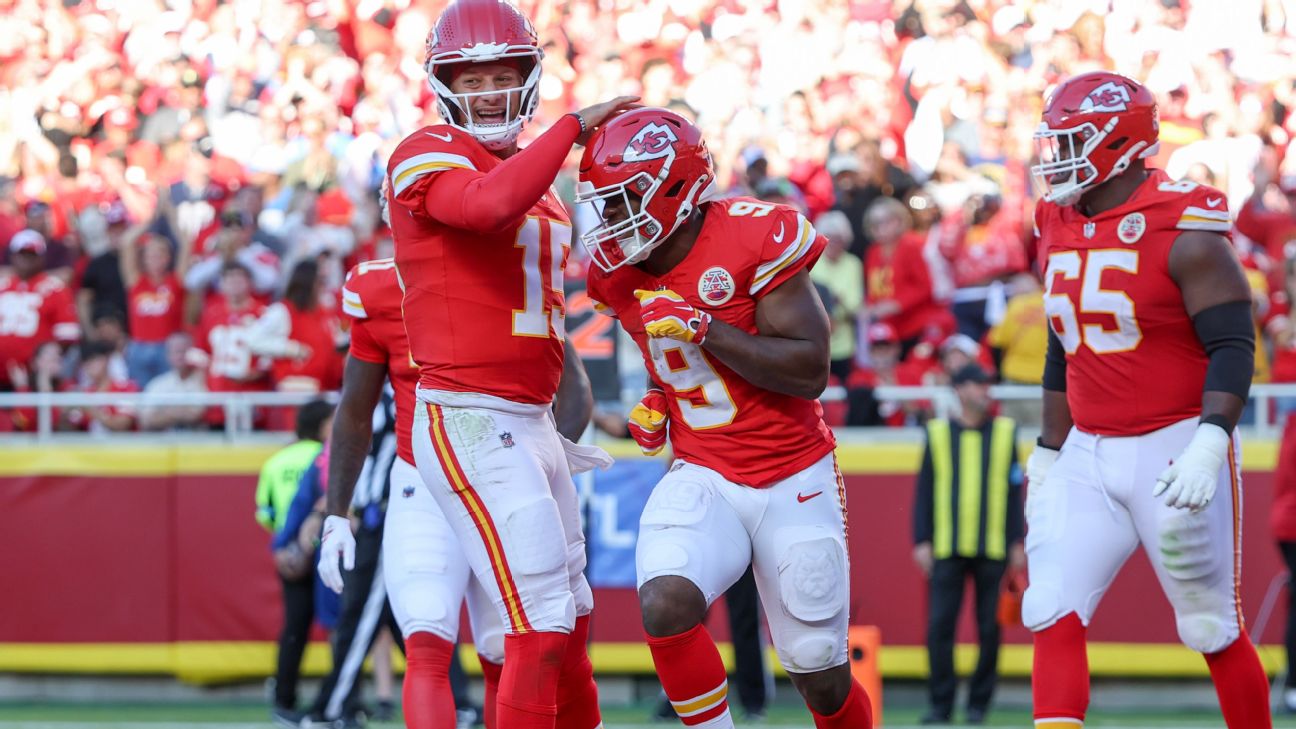
NFL Week 7 betting odds: Lines and totals for every game
A look at the odds, spreads, totals and FPI predictions for every NFL game in Week 7.
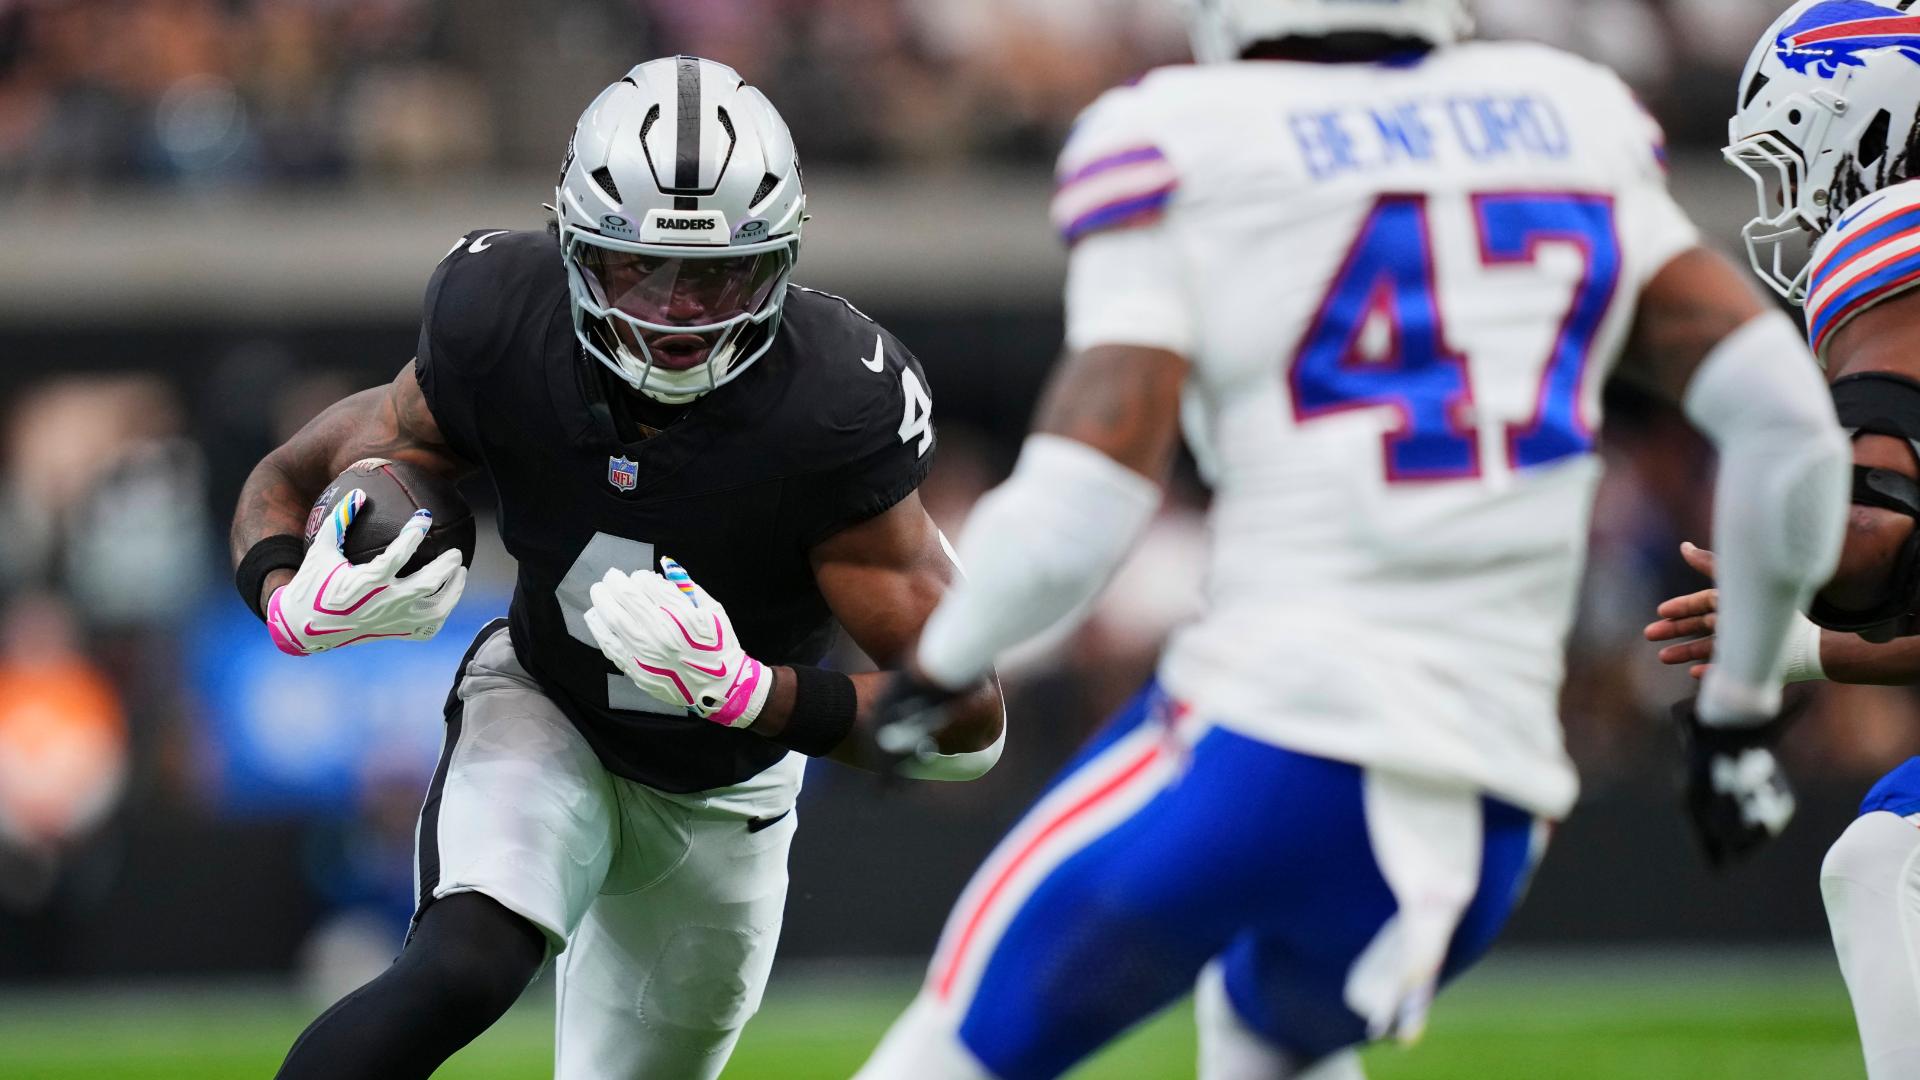
Mike Washington Jr. potentially unavailable for SNF
Ryan McFadden reports on Washington's absence from Thursday's practice due to a foot and back injury.
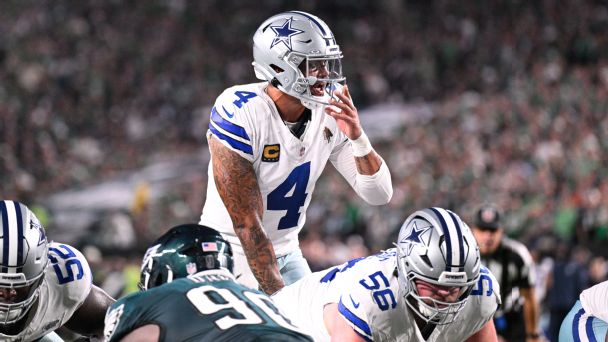
NFL Week 7 preview: Picks, predictions, schedule, betting odds, fantasy tips
Cowboys at Eagles? Bengals at Ravens? The Steelers and Saints in Paris? There are 13 more games in Week 7, and we have picks, predictions and more for all of them.

A battered Rams team faces a near must-win at Las Vegas
— The tone for the Rams' season was set from the beginning when they
| Date | Matchup | Result / Time |
|---|---|---|
| Sep 13, 2026 | Las Vegas Raiders vs Miami Dolphins | Sun, Sep 13 4:25 PM ET |
| Sep 20, 2026 | Las Vegas Raiders @ Los Angeles Chargers | Sun, Sep 20 4:05 PM ET |
| Sep 27, 2026 | Las Vegas Raiders @ New Orleans Saints | Sun, Sep 27 4:25 PM ET |
| Oct 4, 2026 | Las Vegas Raiders vs Kansas City Chiefs | Sun, Oct 4 4:25 PM ET |
| Oct 11, 2026 | Las Vegas Raiders @ New England Patriots | Sun, Oct 11 1:00 PM ET |
| Oct 18, 2026 | Las Vegas Raiders vs Buffalo Bills | Sun, Oct 18 4:25 PM ET |
| Oct 25, 2026 | Las Vegas Raiders vs Los Angeles Rams | Sun, Oct 25 4:25 PM ET |
| Nov 1, 2026 | Las Vegas Raiders @ New York Jets | Sun, Nov 1 1:00 PM ET |
| Nov 8, 2026 | Las Vegas Raiders @ San Francisco 49ers | Sun, Nov 8 4:05 PM ET |
| Nov 15, 2026 | Las Vegas Raiders vs Seattle Seahawks | Sun, Nov 15 4:05 PM ET |
| Nov 22, 2026 | Las Vegas Raiders @ Denver Broncos | Sun, Nov 22 4:25 PM ET |
| Nov 29, 2026 | Las Vegas Raiders @ Cleveland Browns | Sun, Nov 29 1:00 PM ET |
| Dec 13, 2026 | Las Vegas Raiders vs Los Angeles Chargers | Sun, Dec 13 4:05 PM ET |
| Dec 20, 2026 | Las Vegas Raiders vs Denver Broncos | Sun, Dec 20 4:25 PM ET |
| Dec 27, 2026 | Las Vegas Raiders vs Tennessee Titans | Sun, Dec 27 4:05 PM ET |
| Jan 3, 2027 | Las Vegas Raiders @ Arizona Cardinals | Sun, Jan 3 4:05 PM ET |
| Jan 10, 2027 | Las Vegas Raiders @ Kansas City Chiefs | Sun, Jan 10 12:00 AM ET |
Roster
| Player | No | Pos | Status | Height | Weight | Experience | College |
|---|---|---|---|---|---|---|---|
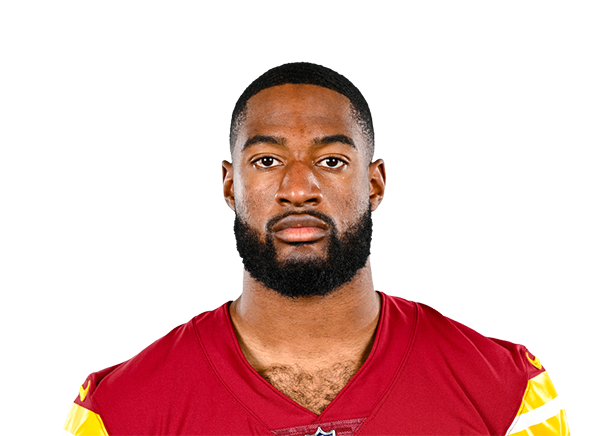 Chigozie Anusiem |
29 | CB | Day-To-Day | 6' 1" | 200 lbs | 2 | Colorado State |
 Jack Bech |
18 | WR | Day-To-Day | 6' 1" | 214 lbs | 2 | TCU |
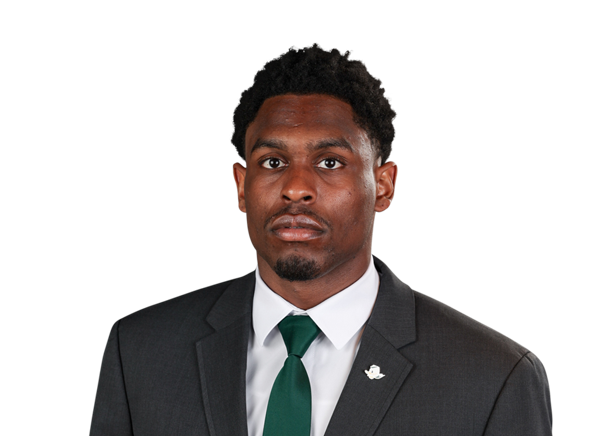 Malik Benson |
19 | WR | Active | 6' 1" | 195 lbs | R | Oregon |
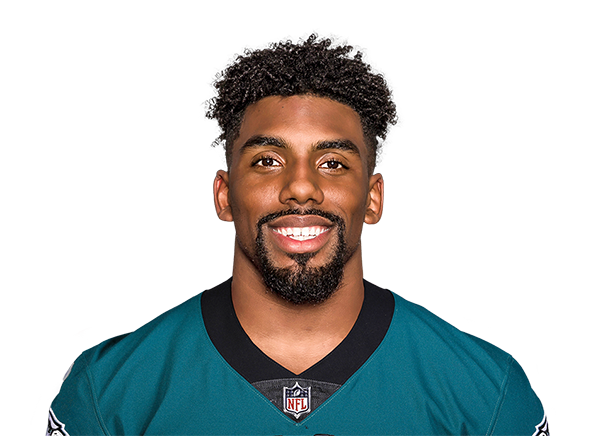 Thomas Booker IV |
99 | DT | Active | 6' 3" | 301 lbs | 4 | Stanford |
 Brock Bowers |
89 | TE | Active | 6' 4" | 235 lbs | 3 | Georgia |
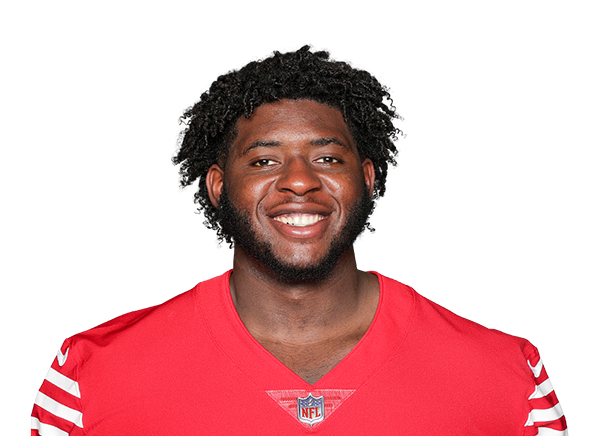 Spencer Burford |
70 | G | Active | 6' 4" | 300 lbs | 5 | UTSA |
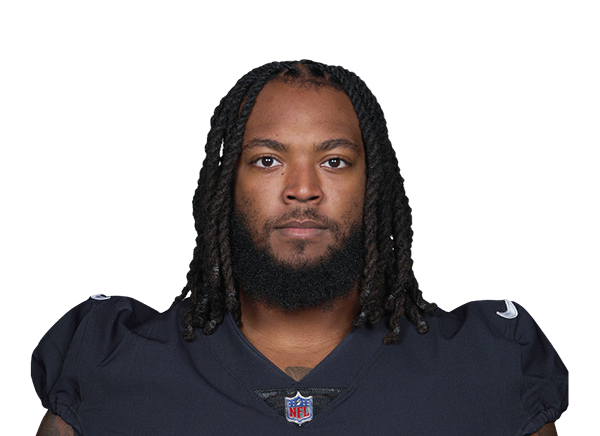 Adam Butler |
69 | DT | Active | 6' 4" | 301 lbs | 9 | Vanderbilt |
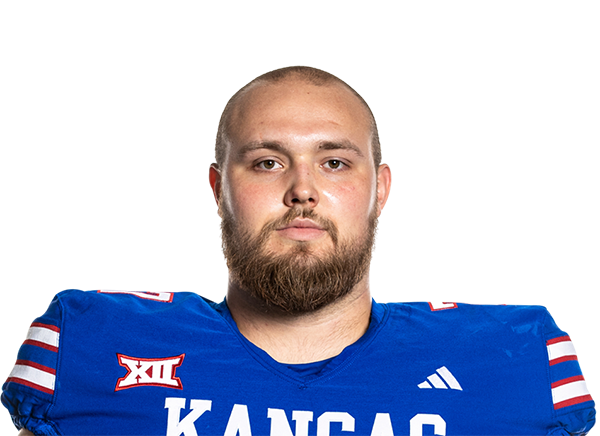 Bryce Cabeldue |
77 | G | Active | 6' 4" | 308 lbs | 2 | Kansas |
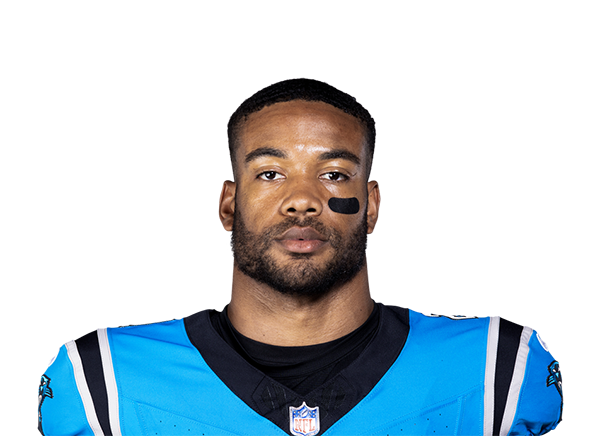 Jeremy Chinn |
11 | S | Active | 6' 3" | 220 lbs | 7 | Southern Illinois |
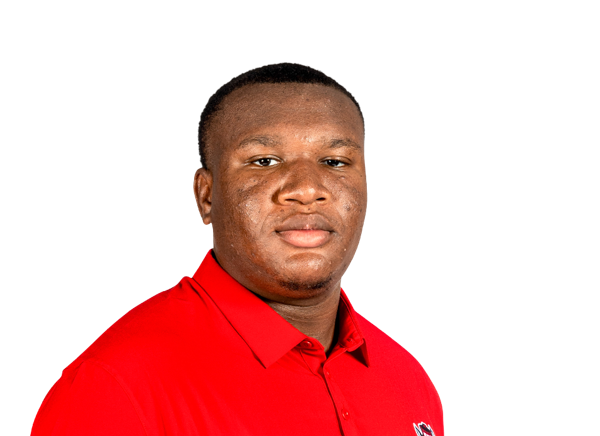 Brandon Cleveland |
90 | DT | Practice Squad | 6' 4" | 315 lbs | R | NC State |
 AJ Cole |
6 | P | Active | 6' 4" | 220 lbs | 8 | NC State |
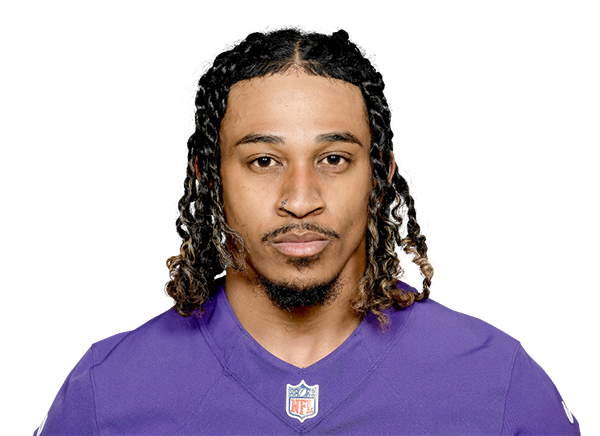 Chris Collier |
33 | RB | Day-To-Day | 5' 10" | 203 lbs | 2 | Lock Haven |
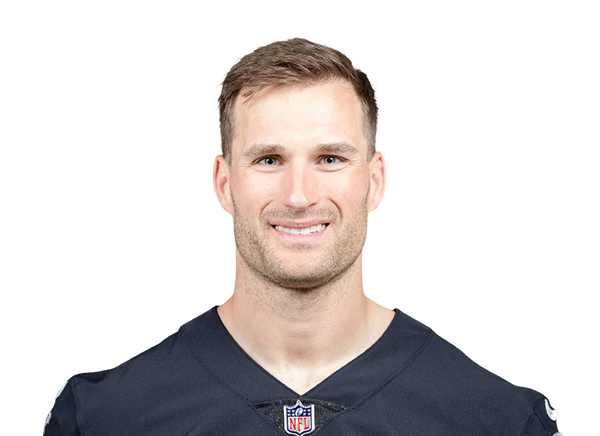 Kirk Cousins |
8 | QB | Active | 6' 3" | 209 lbs | 15 | Michigan State |
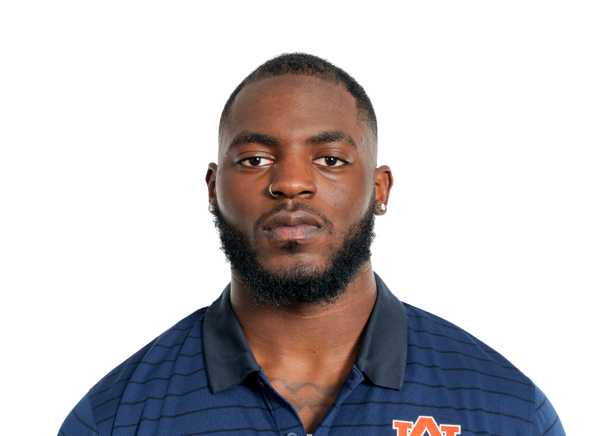 Keyron Crawford |
42 | DE | Day-To-Day | 6' 4" | 253 lbs | R | Auburn |
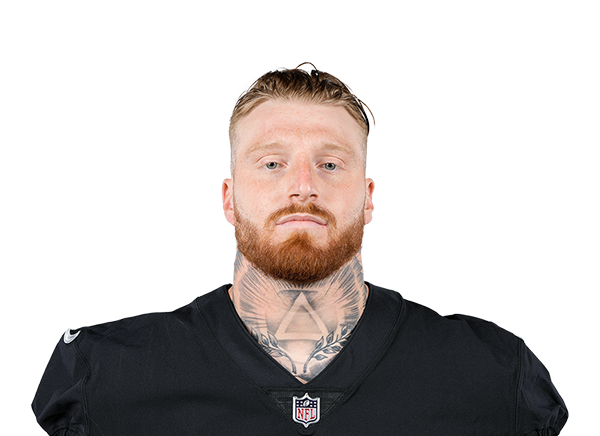 Maxx Crosby |
98 | DE | Active | 6' 5" | 255 lbs | 8 | Eastern Michigan |
 Nakobe Dean |
17 | LB | Active | 5' 11" | 230 lbs | 5 | Georgia |
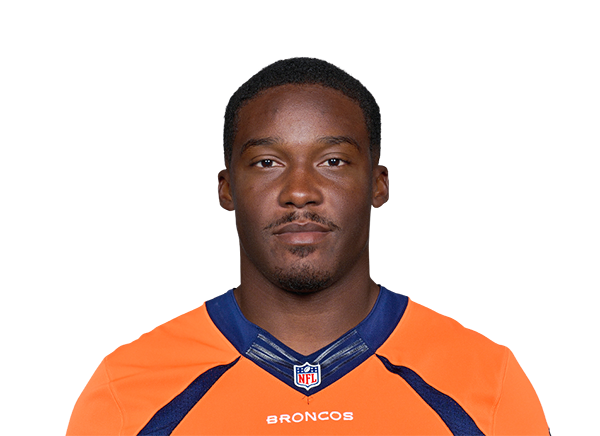 Phillip Dorsett II |
13 | WR | Practice Squad | 5' 10" | 185 lbs | 9 | Miami |
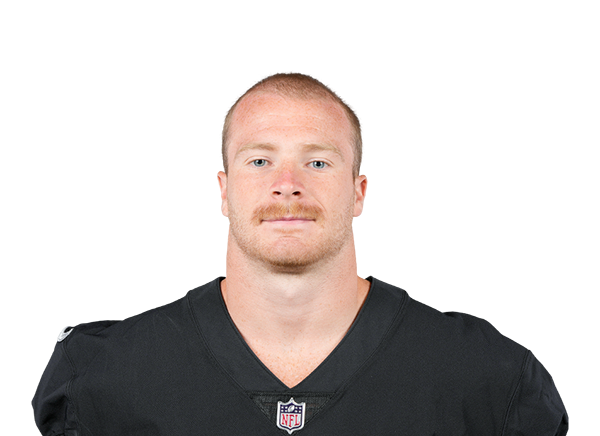 Tommy Eichenberg |
44 | LB | Active | 6' 2" | 234 lbs | 3 | Ohio State |
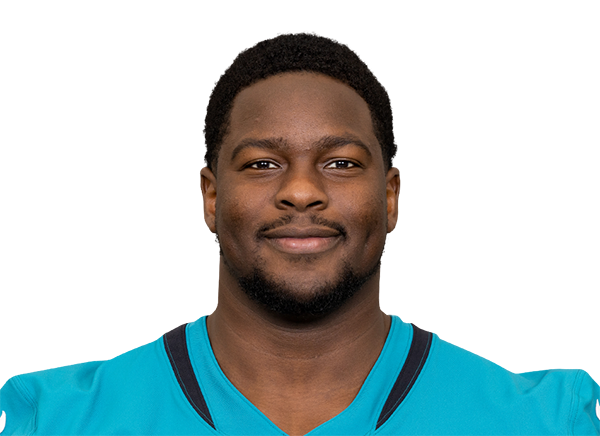 Folorunso Fatukasi |
94 | DT | Active | 6' 4" | 318 lbs | 8 | UConn |
 Matt Gay |
14 | PK | Active | 6' 0" | 232 lbs | 7 | Utah |
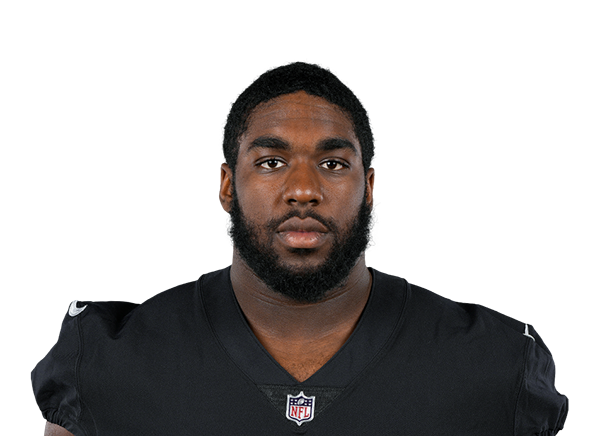 DJ Glaze |
71 | OT | Active | 6' 4" | 331 lbs | 3 | Maryland |
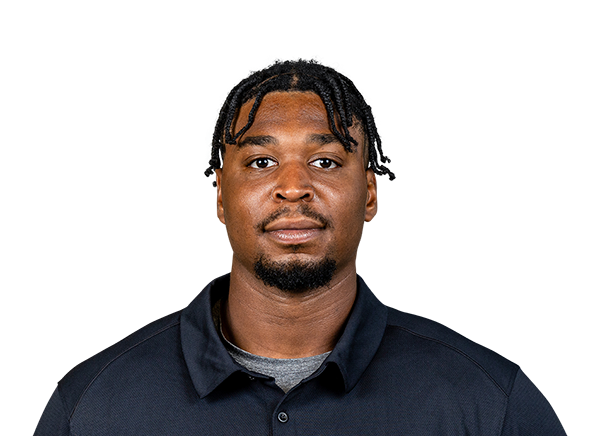 Charles Grant |
60 | OT | Active | 6' 4" | 304 lbs | 2 | William & Mary |
 Patrick Gurd |
45 | TE | Practice Squad | 6' 4" | 250 lbs | R | Cincinnati |
 Roman Hemby |
37 | RB | Active | 6' 0" | 210 lbs | R | Indiana |
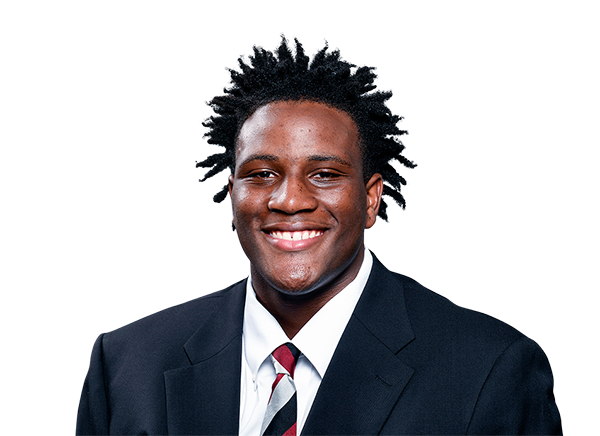 Tonka Hemingway |
97 | DT | Active | 6' 2" | 284 lbs | 2 | South Carolina |
 Niklas Henning |
73 | OT | Practice Squad | 6' 6" | 287 lbs | R | - |
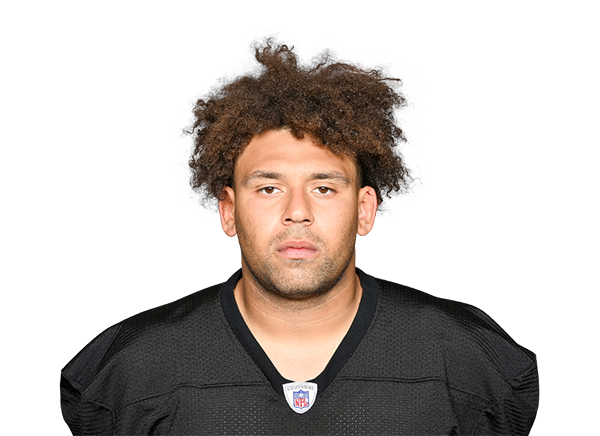 Connor Heyward |
34 | FB | Active | 6' 0" | 230 lbs | 5 | Michigan State |
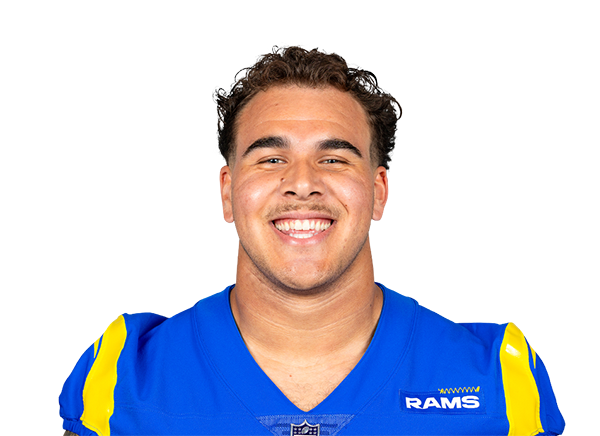 Brennan Jackson |
54 | LB | Day-To-Day | 6' 4" | 263 lbs | 3 | Washington State |
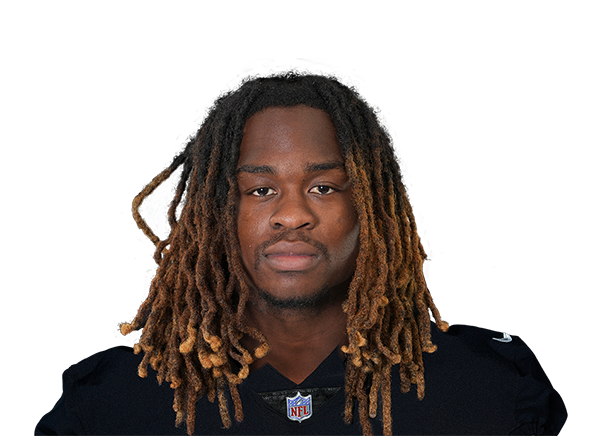 Ashton Jeanty |
2 | RB | Active | 5' 8" | 208 lbs | 2 | Boise State |
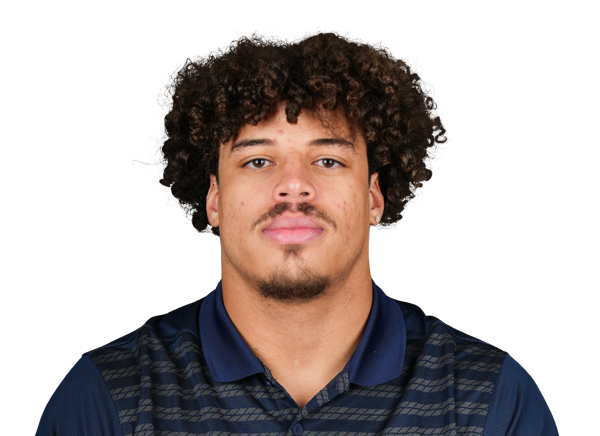 Dalton Johnson |
43 | S | Active | 5' 11" | 198 lbs | R | Arizona |
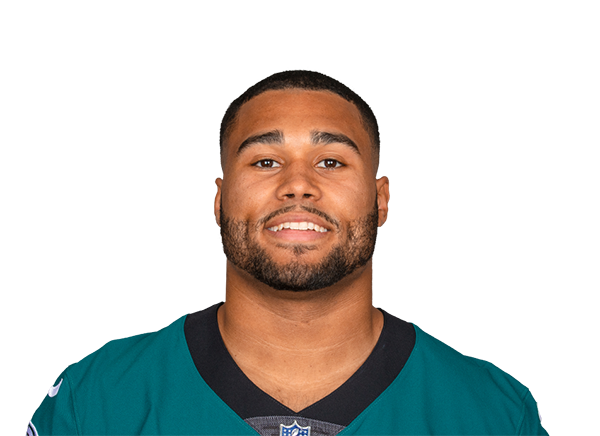 Patrick Johnson |
93 | DE | Active | 6' 2" | 248 lbs | 6 | Tulane |
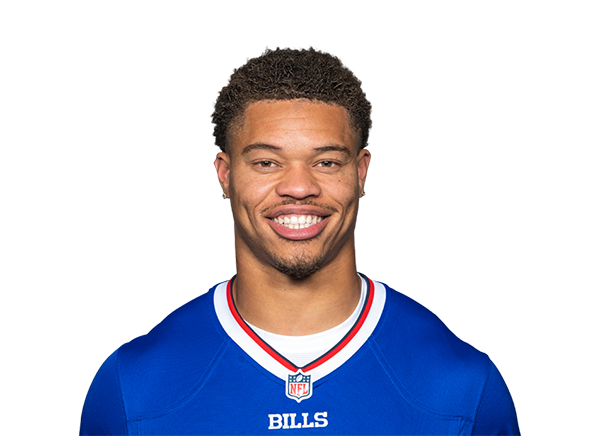 Taron Johnson |
3 | CB | Active | 5' 11" | 192 lbs | 9 | Weber State |
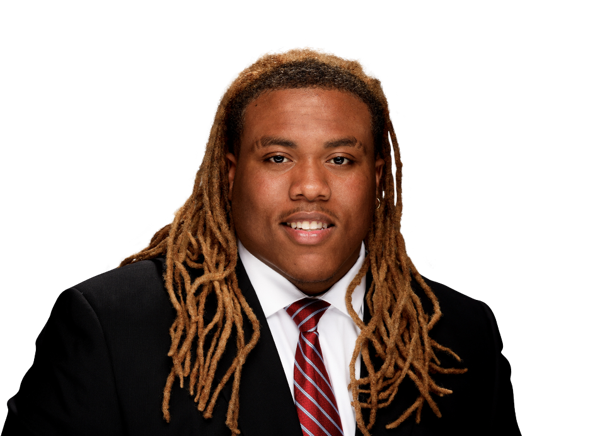 Tim Keenan III |
- | DT | Active | 6' 1" | 327 lbs | R | Alabama |
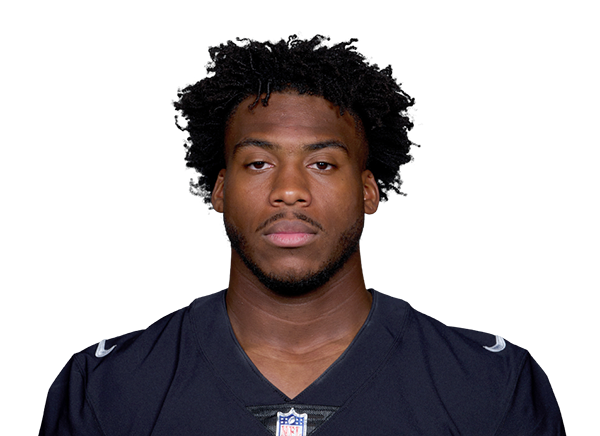 Malcolm Koonce |
51 | DE | Active | 6' 3" | 243 lbs | 6 | Buffalo |
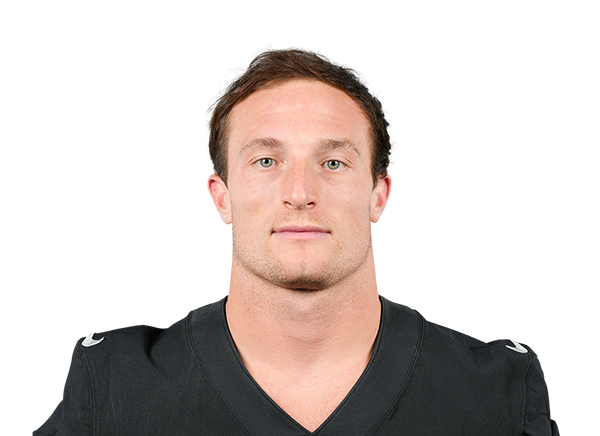 Dylan Laube |
23 | RB | Active | 5' 9" | 204 lbs | 3 | New Hampshire |
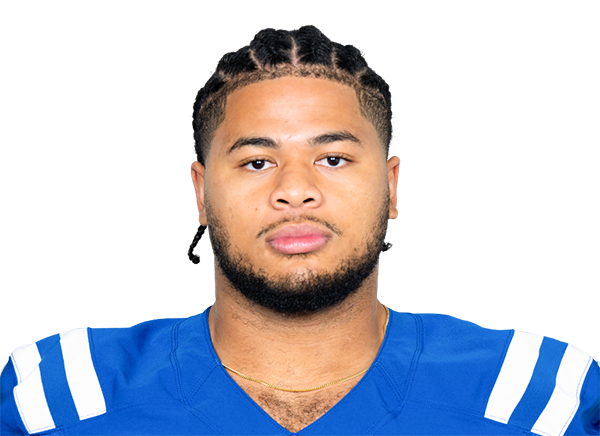 Jonah Laulu |
96 | DT | Active | 6' 5" | 289 lbs | 3 | Oklahoma |
 Cody Lindenberg |
55 | LB | Active | 6' 2" | 236 lbs | 2 | Minnesota |
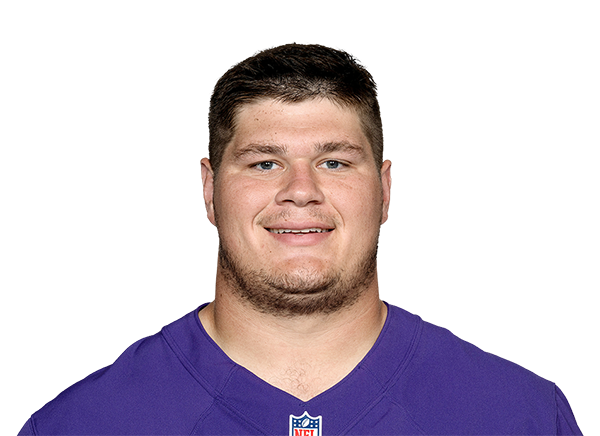 Tyler Linderbaum |
65 | C | Active | 6' 2" | 305 lbs | 5 | Iowa |
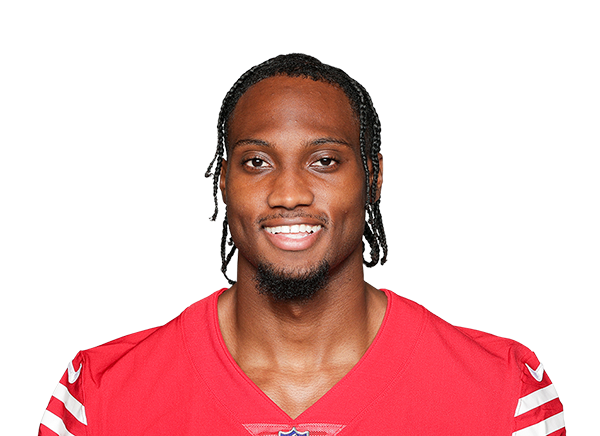 Darrell Luter Jr. |
25 | CB | Active | 6' 0" | 190 lbs | 4 | South Alabama |
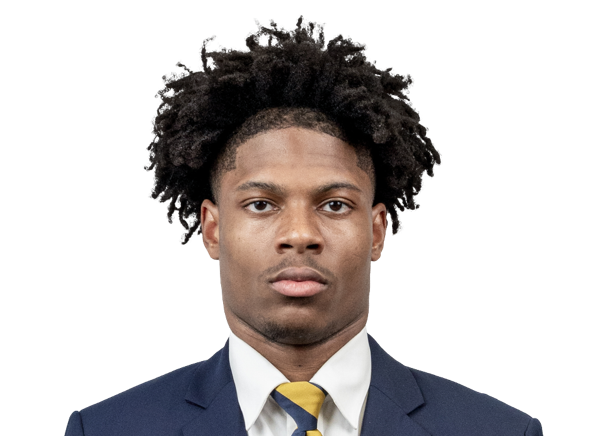 Hezekiah Masses |
35 | CB | Active | 6' 1" | 185 lbs | R | California |
 Kansei Matsuzawa |
38 | PK | Practice Squad | 6' 2" | 200 lbs | R | Hawai'i |
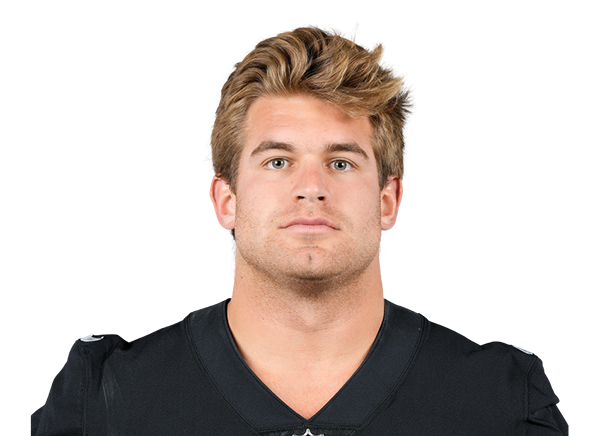 Michael Mayer |
87 | TE | Active | 6' 4" | 256 lbs | 4 | Notre Dame |
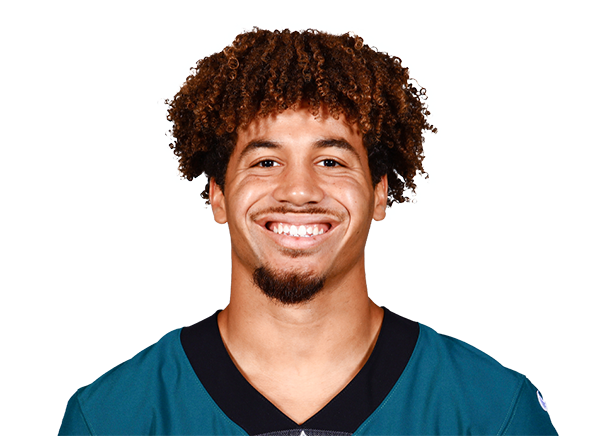 Tristin McCollum |
27 | S | Active | 6' 3" | 195 lbs | 3 | Sam Houston |
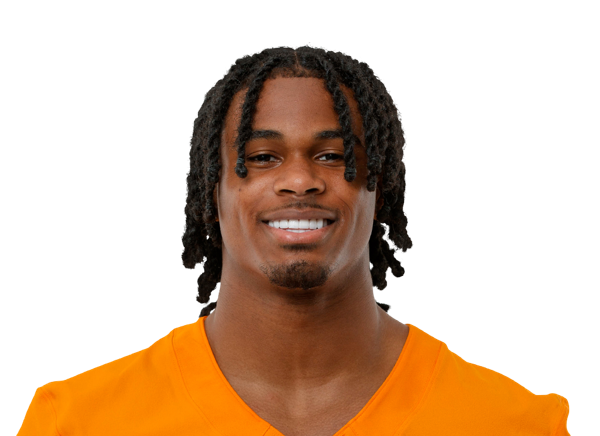 Jermod McCoy |
28 | CB | Active | 6' 0" | 193 lbs | R | Tennessee |
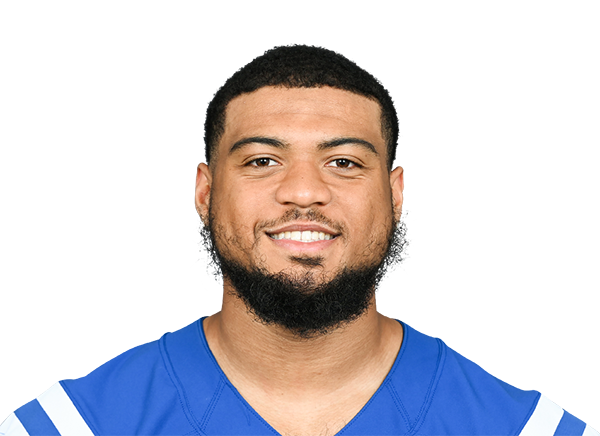 Cameron McGrone |
57 | LB | Practice Squad | 6' 3" | 236 lbs | 3 | Michigan |
 Fernando Mendoza |
15 | QB | Active | 6' 5" | 225 lbs | R | Indiana |
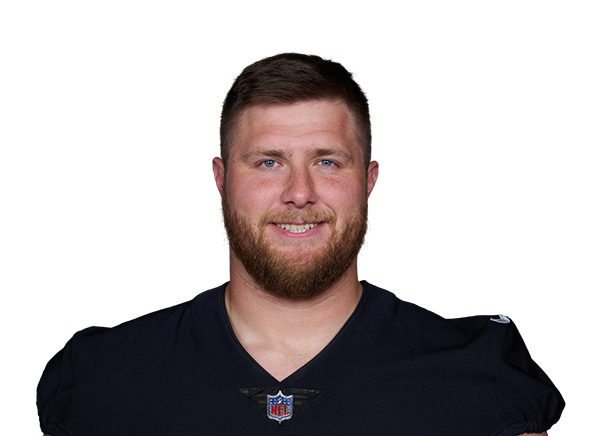 Kolton Miller |
74 | OT | Active | 6' 8" | 326 lbs | 9 | UCLA |
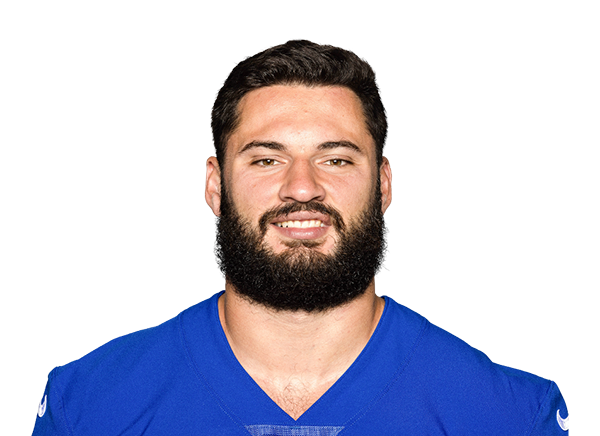 Chris Myarick |
41 | TE | Active | 6' 5" | 261 lbs | 5 | Temple |
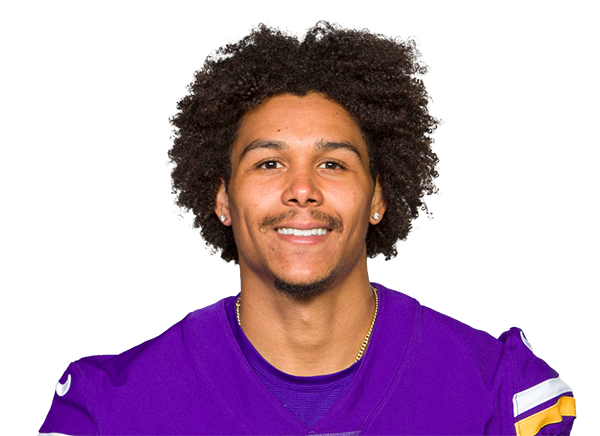 Jalen Nailor |
9 | WR | Active | 6' 0" | 190 lbs | 5 | Michigan State |
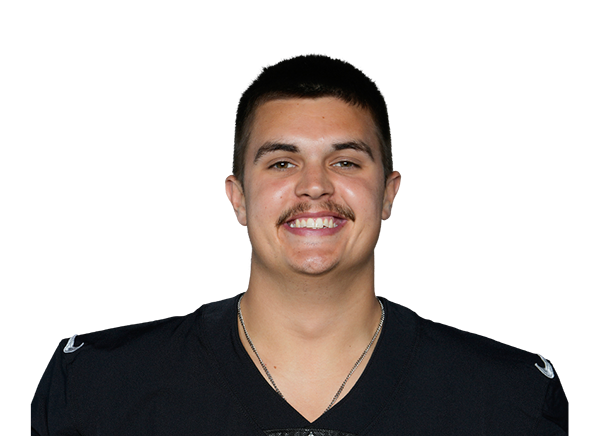 Aidan O'Connell |
12 | QB | Active | 6' 3" | 206 lbs | 4 | Purdue |
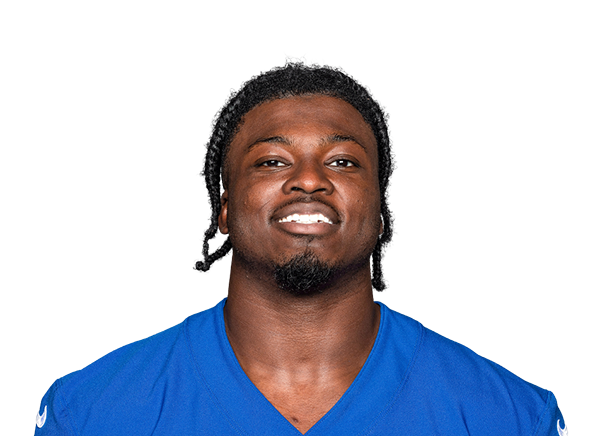 Azeez Ojulari |
- | LB | Practice Squad | 6' 3" | 240 lbs | 6 | Georgia |
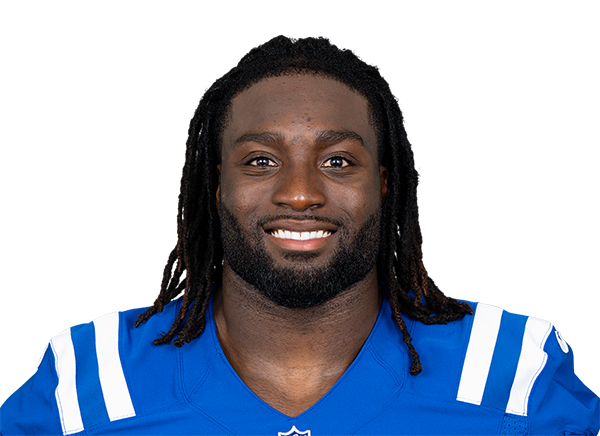 Segun Olubi |
50 | LB | Active | 6' 2" | 220 lbs | 4 | San Diego State |
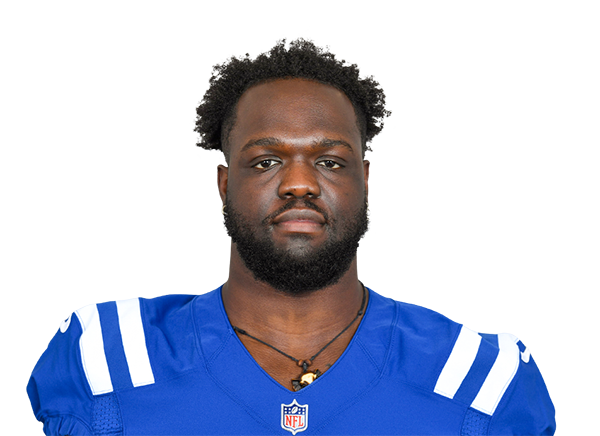 Kwity Paye |
95 | DE | Active | 6' 3" | 265 lbs | 6 | Michigan |
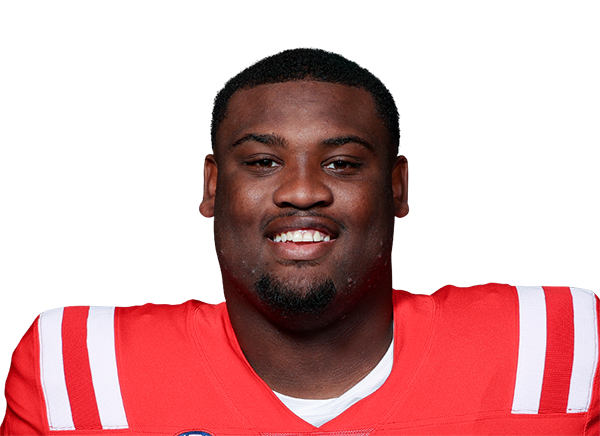 JJ Pegues |
92 | DT | Active | 6' 2" | 325 lbs | 2 | Ole Miss |
 Justin Pickett |
77 | G | Day-To-Day | 6' 7" | 317 lbs | R | Duke |
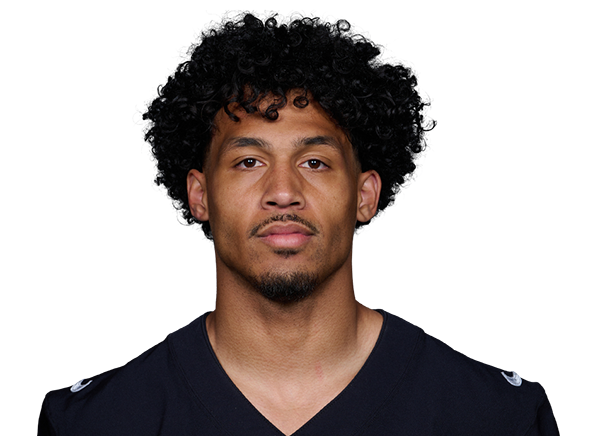 Isaiah Pola-Mao |
20 | S | Active | 6' 3" | 204 lbs | 5 | USC |
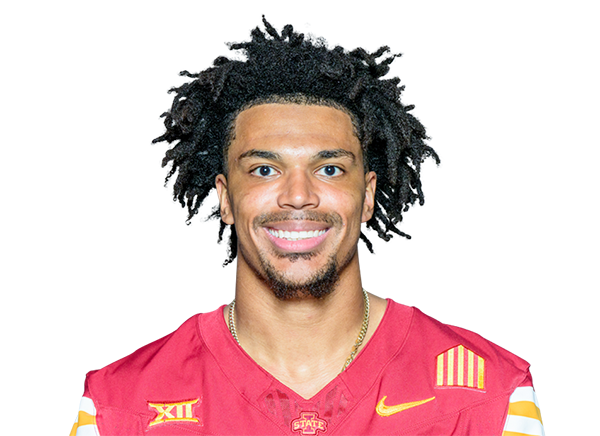 Darien Porter |
26 | CB | Active | 6' 2" | 195 lbs | 2 | Iowa State |
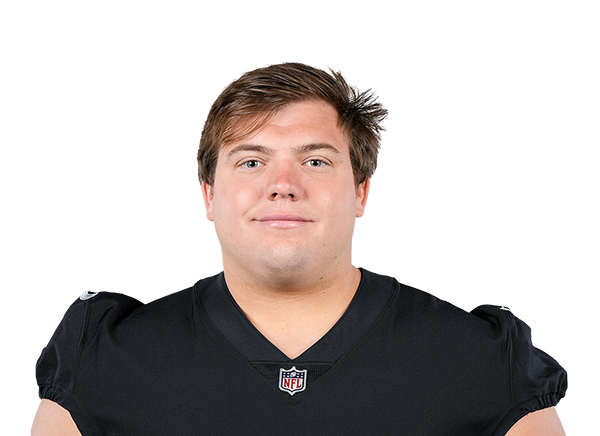 Jackson Powers-Johnson |
58 | G | Active | 6' 3" | 325 lbs | 3 | Oregon |
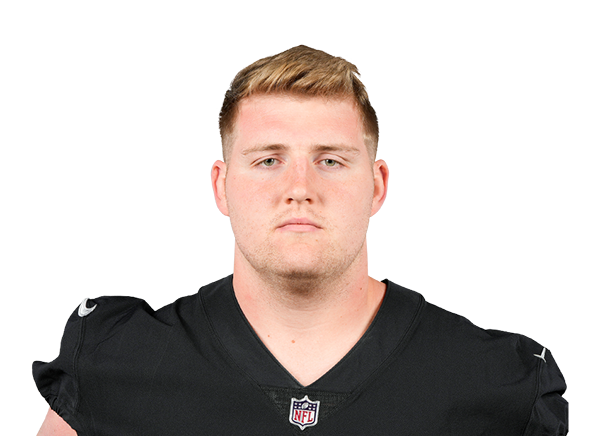 Will Putnam |
67 | C | Practice Squad | 6' 4" | 301 lbs | 2 | Clemson |
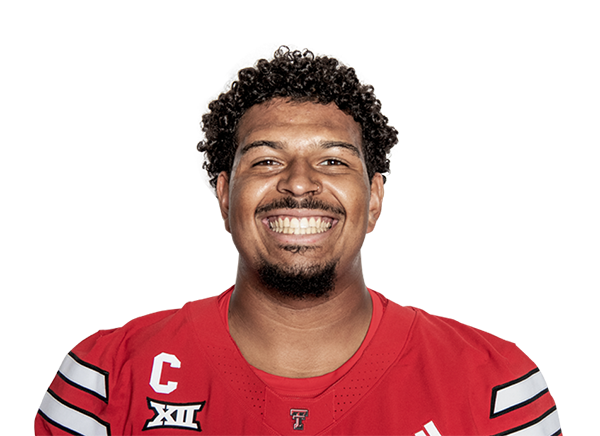 Caleb Rogers |
76 | G | Active | 6' 4" | 312 lbs | 2 | Texas Tech |
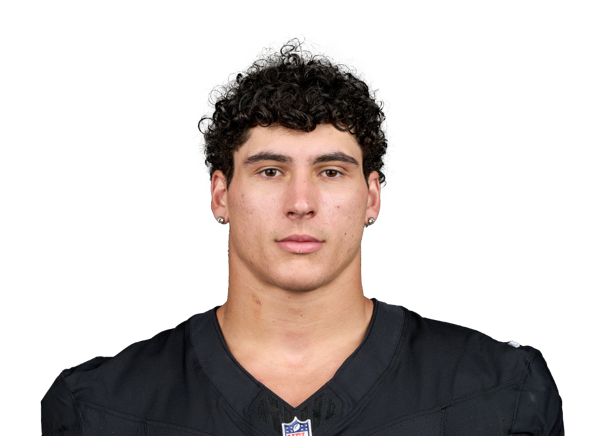 Carter Runyon |
84 | TE | Day-To-Day | 6' 4" | 243 lbs | 2 | Towson |
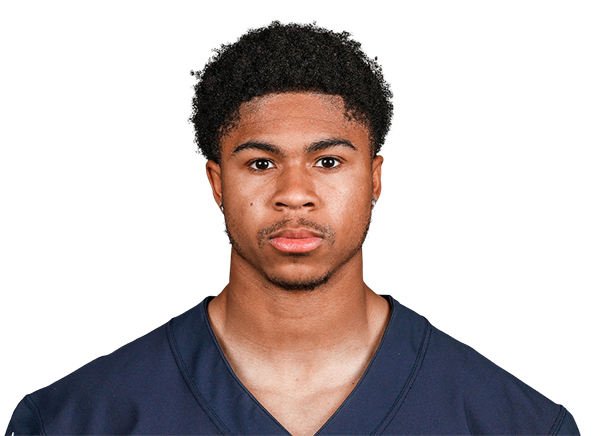 Tyler Scott |
- | WR | Practice Squad | 5' 11" | 185 lbs | 3 | Cincinnati |
 Cian Slone |
48 | DE | Active | 6' 3" | 239 lbs | R | NC State |
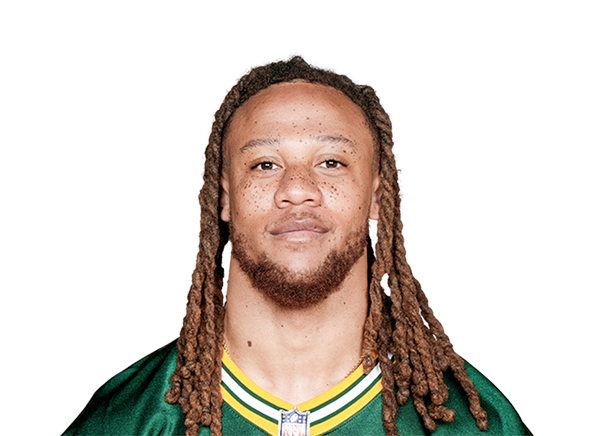 Eric Stokes |
5 | CB | Active | 6' 1" | 193 lbs | 6 | Georgia |
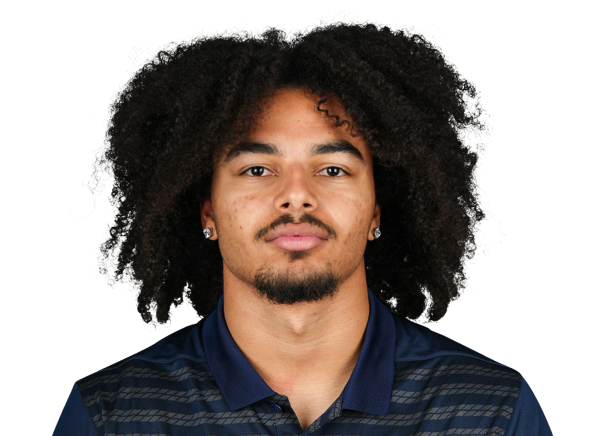 Treydan Stukes |
31 | S | Active | 6' 2" | 200 lbs | R | Arizona |
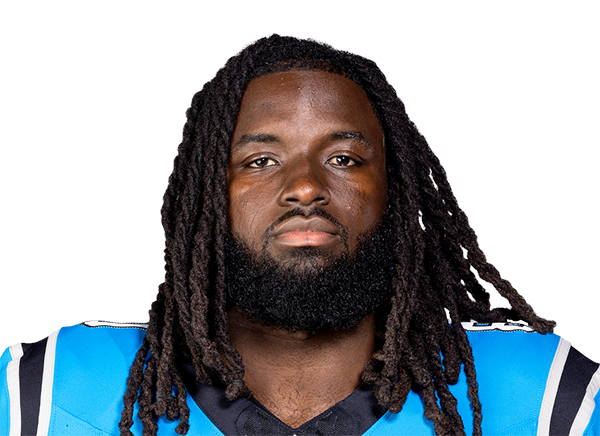 Ian Thomas |
80 | TE | Active | 6' 3" | 253 lbs | 9 | Indiana |
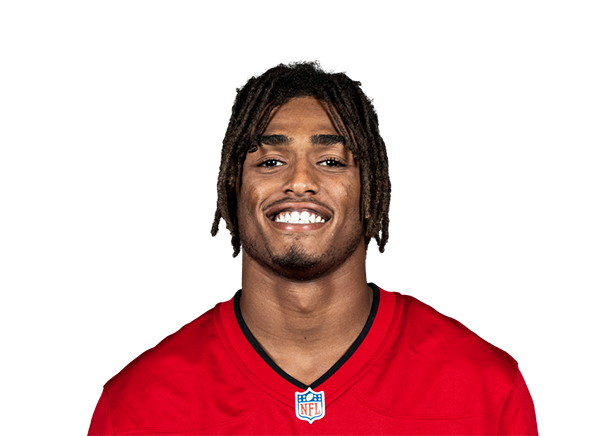 Deven Thompkins |
83 | WR | Active | 5' 8" | 155 lbs | 5 | Utah State |
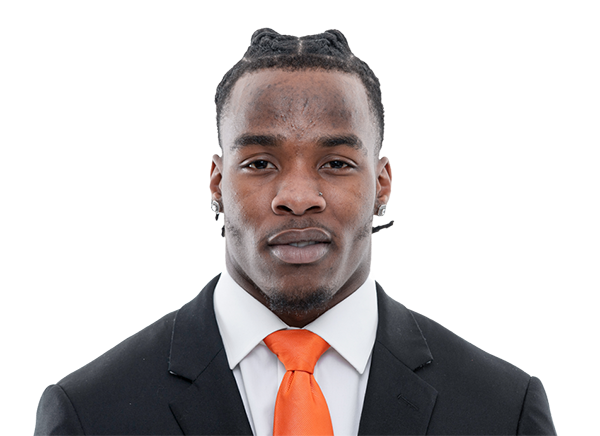 Dont'e Thornton Jr. |
10 | WR | Day-To-Day | 6' 5" | 205 lbs | 2 | Tennessee |
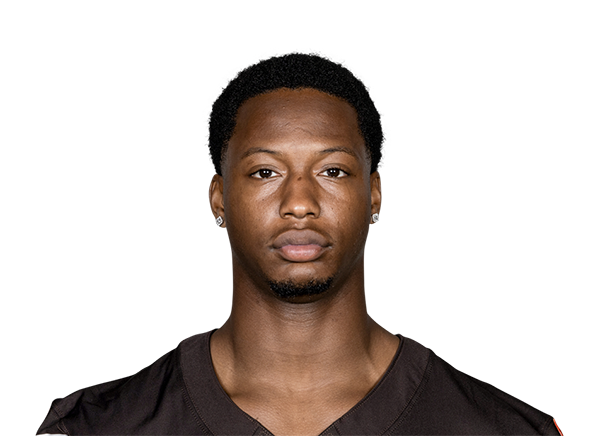 Jamari Thrash |
- | WR | Practice Squad | 6' 0" | 190 lbs | R | Louisville |
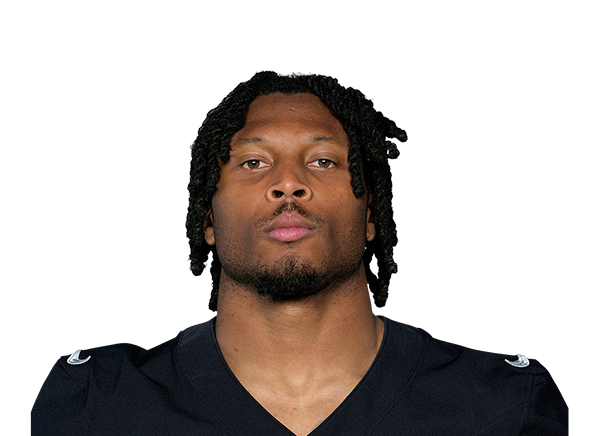 Tre Tucker |
1 | WR | Active | 5' 8" | 182 lbs | 4 | Cincinnati |
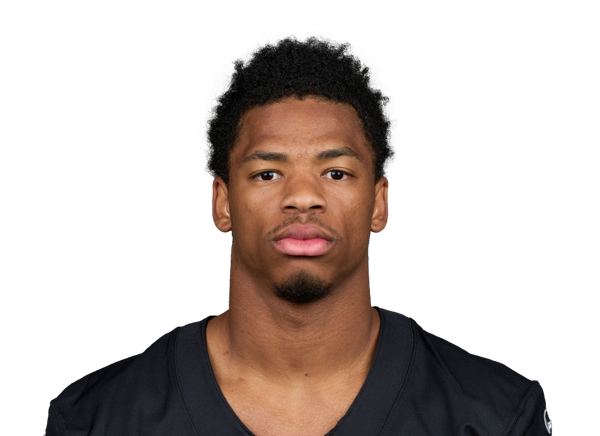 Greedy Vance |
22 | CB | Practice Squad | 5' 9" | 177 lbs | 2 | USC |
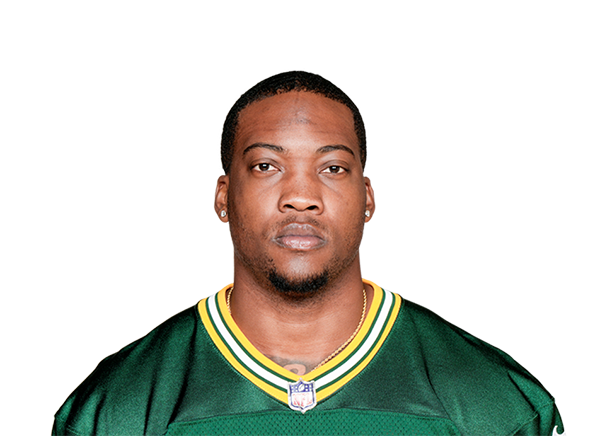 Quay Walker |
7 | LB | Active | 6' 4" | 240 lbs | 5 | Georgia |
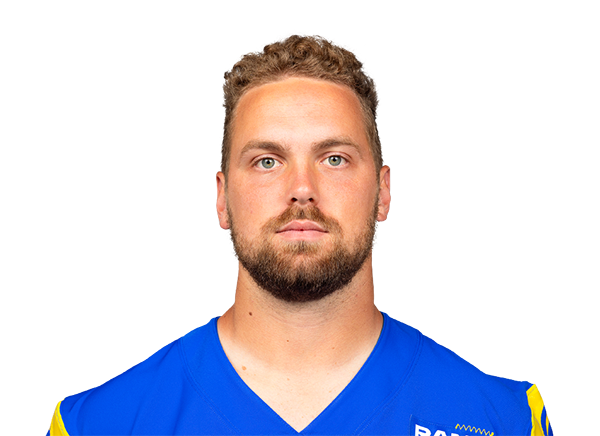 Alex Ward |
47 | LS | Active | 6' 4" | 240 lbs | 4 | UCF |
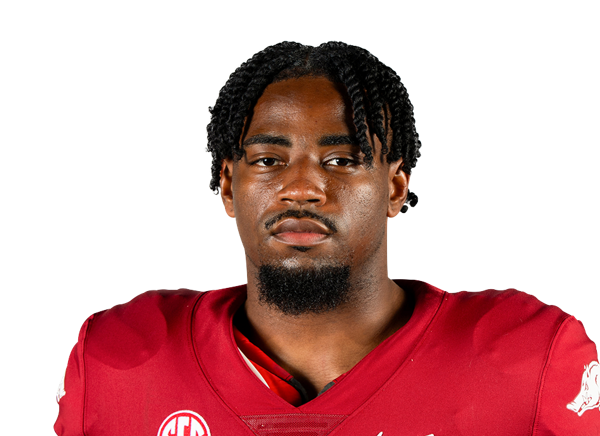 Mike Washington Jr. |
4 | RB | Active | 6' 2" | 228 lbs | R | Arkansas |
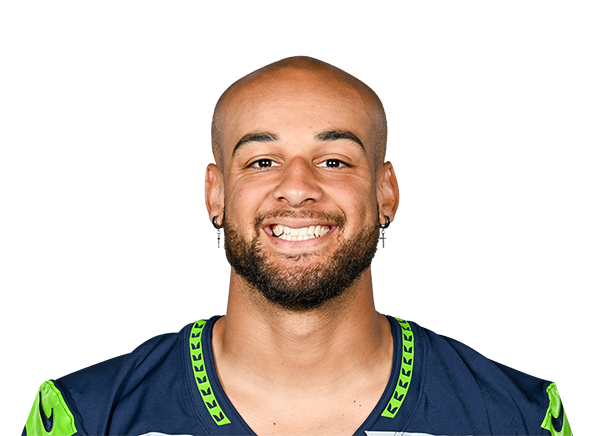 Cody White |
82 | WR | Active | 6' 3" | 227 lbs | 6 | Michigan State |
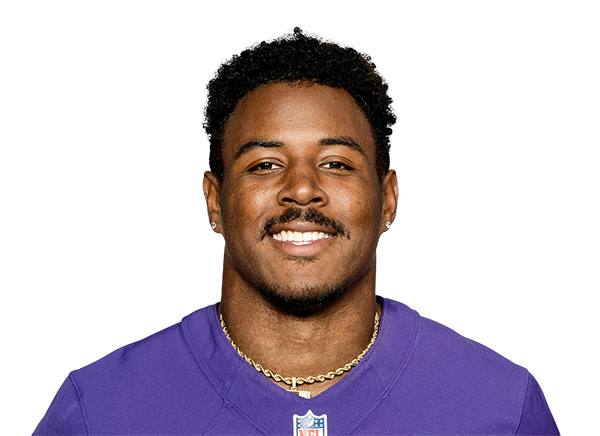 Owen Wright |
- | RB | Practice Squad | 5' 9" | 217 lbs | 2 | Monmouth |
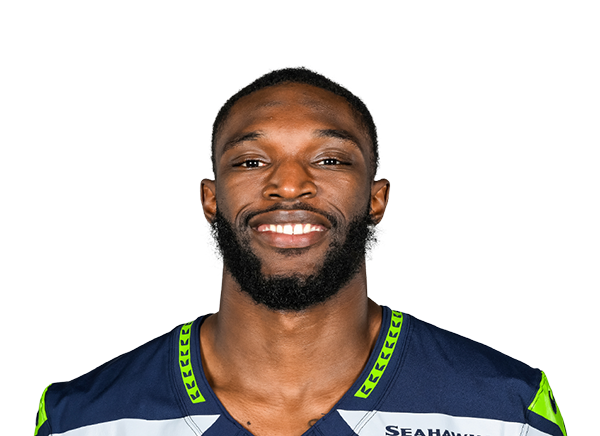 Dareke Young |
81 | WR | Active | 6' 2" | 224 lbs | 5 | Lenoir Rhyne |
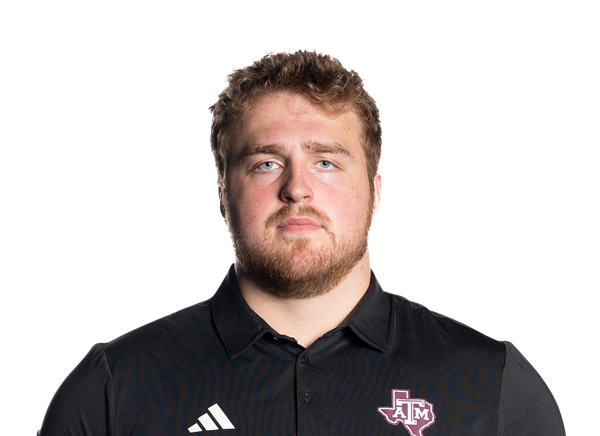 Trey Zuhn III |
66 | C | Active | 6' 7" | 319 lbs | R | Texas A&M |
Las Vegas Raiders — Stats
Team Scoring
| Wins | 3 |
| Losses | 3 |
| Ties | 0 |
| Win % | 0.5 |
| Points For | 162 |
| Points Against | 162 |
| Point Differential | 0 |
| Streak | -3 |
| Division Record | 0 |
Passing
| Completion Percentage | 63.8 |
| Completions | 141 |
| Interception Percentage | 2.30 |
| Interceptions | 5 |
| Longest Pass | 44 |
| Net Passing Yards | 1,581 |
| Net Passing Yards Per Game | 263.5 |
| Passing Attempts | 221 |
| Passing Touchdown % | 6.30 |
| Passing Touchdowns | 14 |
| Passer Rating | 97.7 |
| Total Sacks | 8 |
| Sack Yards Lost | 49 |
| Yards Per Pass Attempt | 7.4 |
| Passing Yards | 1,630 |
| Passing Fumbles Lost | 1 |
| Team Games Played | 6 |
| Yards Per Game | 350.8 |
| Total Points Per Game | 27.0 |
| Total Points | 162 |
| Total Touchdowns | 17 |
| Passing Yards Per Game | 271.7 |
| Comp-Att | 141-221 |
| Sacks-Yards Lost | 8-49 |
Rushing
| Rushing Attempts | 157 |
| Rushing Yards | 475 |
| Yards Per Rush Attempt | 3.0 |
| Long Rushing | 36 |
| 20+ Yard Rushing Plays | 1 |
| Rushing Touchdowns | 3 |
| Rushing Yards Per Game | 79.2 |
| Rushing Fumbles | 0 |
| Rushing Fumbles Lost | 0 |
| Rushing 1st downs | 26 |
| Team Games Played | 6 |
| Total Yards | 2,105 |
| Total Offensive Plays | 386 |
| Total Points Per Game | 27.0 |
| Total Points | 162 |
| Total Touchdowns | 17 |
Receiving
| Receptions | 141 |
| Receiving Targets | 212 |
| Receiving Yards | 1,630 |
| Receiving Yards | 1,630 |
| Receiving Touchdowns | 14 |
| Long Reception | 44 |
| 20+ Yard Receiving Plays | 21 |
| Receiving Yards Per Game | 271.7 |
| Receiving Fumbles | 2 |
| Receiving Fumbles Lost | 1 |
| Receiving Yards After Catch | 665 |
| Receiving First Downs | 85 |
| Team Games Played | 6 |
| Yards Per Reception | 11.6 |
| Total Points Per Game | 27.0 |
| Total Points | 162 |
| Total Touchdowns | 17 |
Miscellaneous
| Total 1st downs | 128 |
| Rushing 1st downs | 26 |
| Passing 1st downs | 85 |
| 1st downs by penalty | 17 |
| Third Down Conversions | 33 |
| Third Down Attempts | 78 |
| 3rd down % | 42.31 |
| Fourth Down Conversions | 4 |
| First Downs Attempts | 8 |
| 4th down % | 50.00 |
| Total Penalties | 38 |
| Total Penalty Yards | 283 |
| Possession Time Seconds | 10775 |
| Red Zone Field Goal Percentage | 34.78 |
| Red Zone Scoring Percentage | 86.96 |
| Red Zone Efficiency Percentage | 67.08 |
| Red Zone Touchdown Percentage | 52.17 |
| Total Takeaways | 10 |
| Total Giveaways | 8 |
| Turnover Ratio | 2 |
| Fumbles Lost | 3 |
| 3rd down efficiency | 33-78 |
| 4th down efficiency | 4-8 |
| Total-Yards | 38-283 |
Defense
| Solo Tackles | 219 |
| Assist Tackles | 184 |
| Total Tackles | 403 |
| Sacks | 15 |
| Sack Yards | 97 |
| Stuffs | 24 |
| Passes Defended | 24 |
| Average Interception Yards | 16.8 |
| Long Interception | 35 |
| Miscellaneous Touchdowns | 0 |
| Kicks Blocked | 1 |
| Tackles For Loss | 26 |
| Team Games Played | 6 |
Defensive Interceptions
| Interceptions | 4 |
| Interception Yards | 67 |
| Interception Touchdowns | 0 |
| INT: Total | 4-67 |
General
| Fumbles | 7 |
| Forced Fumbles | 11 |
| Fumbles Recovered | 6 |
| Fumbles Touchdowns | 0 |
| Games Played | 6 |
| Fumbles-Lost | 7-3 |
Returning
| Kick Returns | 26 |
| Kick Return Yards | 714 |
| Yards Per Kick Return | 27.5 |
| Long Kick Return | 53 |
| Kick Return Touchdowns | 0 |
| Punt Returns | 6 |
| Punt Return Yards | 86 |
| Yards Per Punt Return | 14.3 |
| Long Punt Return | 23 |
| Punt Return Touchdowns | 0 |
| Punt Return Fair Catches | 10 |
| Kick Return Fumbles Lost | 0 |
| Punt Return Fumbles Lost | 0 |
| Team Games Played | 6 |
| Punt: Total | 6-86 |
Kicking
| Field Goal Made | 14 |
| Field Goal Attempts | 15 |
| Field Goal Percentage | 93.3 |
| Long Field Goal Made | 59 |
| Field Goal Attempts 1-19 | 0 |
| Field Goal Attempts 20-29 | 3 |
| Field Goal Attempts 30-39 | 4 |
| Field Goal Attempts 40-49 | 7 |
| Field Goal Attempts 50+ | 1 |
| Extra Points Made | 14 |
| Extra Point Attempts | 14 |
| Extra Point Percentage | 100.0 |
| Field Goals Made 1-19 | 0 |
| Field Goals Made 20-29 | 3 |
| Field Goals Made 30-39 | 4 |
| Field Goals Made 40-49 | 6 |
| Field Goals Made 50+ | 1 |
| Total Kicking Points | 56 |
| Team Games Played | 6 |
| Touchback Percentage | 12 |
| Average Kickoff Return Yards | 24.9 |
| Kickoff Return Yards | 648 |
| Kickoff Returns | 26 |
| Kickoffs: Total | 26-648 |
| FG: Good-Attempts | 14-15 |
Punting
| Punts | 22 |
| Punt Yards | 1,114 |
| Long Punt | 72 |
| Gross Average Punt Yards | 50.6 |
| Net Average Punt Yards | 45.1 |
| Punts Blocked | 0 |
| Punts Inside 20 | 8 |
| Touchbacks | 2 |
| Fair Catches | 4 |
| Punt Returns | 9 |
| Punt Return Yards | 121 |
| Average Punt Return Yards | 13.4 |
| Team Games Played | 6 |
| Punt: Total Yards | 22-1,114 |
Scoring
| Rushing Touchdowns | 3 |
| Receiving Touchdowns | 14 |
| Return Touchdowns | 0 |
| Total Touchdowns | 17 |
| Field Goals | 14 |
| Kick Extra Points | 14 |
| Total Two Point Conversions | 1 |
| Total Points | 162 |
| Total Points Per Game | 27.0 |
Passing
| Completion Percentage | 63.7 |
| Completions | 123 |
| Interception Percentage | 2.07 |
| Interceptions | 4 |
| Longest Pass | 55 |
| Net Passing Yards | 1,424 |
| Net Passing Yards Per Game | 237.3 |
| Passing Attempts | 193 |
| Passing Touchdown % | 6.74 |
| Passing Touchdowns | 13 |
| Passer Rating | 101.8 |
| Total Sacks | 15 |
| Sack Yards Lost | 97 |
| Yards Per Pass Attempt | 7.9 |
| Passing Yards | 1,521 |
| Passing Fumbles Lost | 2 |
| Team Games Played | 6 |
| Yards Per Game | 387.8 |
| Total Points Per Game | 27.0 |
| Total Points | 162 |
| Total Touchdowns | 20 |
| Passing Yards Per Game | 253.5 |
| Comp-Att | 123-193 |
| Sacks-Yards Lost | 15-97 |
Rushing
| Rushing Attempts | 164 |
| Rushing Yards | 806 |
| Yards Per Rush Attempt | 4.9 |
| Long Rushing | 76 |
| 20+ Yard Rushing Plays | 6 |
| Rushing Touchdowns | 7 |
| Rushing Yards Per Game | 134.3 |
| Rushing Fumbles | 4 |
| Rushing Fumbles Lost | 2 |
| Rushing 1st downs | 43 |
| Team Games Played | 6 |
| Total Yards | 2,327 |
| Total Offensive Plays | 372 |
| Total Points Per Game | 27.0 |
| Total Points | 162 |
| Total Touchdowns | 20 |
Receiving
| Receptions | 123 |
| Receiving Targets | 181 |
| Receiving Yards | 1,521 |
| Receiving Yards | 1,521 |
| Receiving Touchdowns | 13 |
| Long Reception | 55 |
| 20+ Yard Receiving Plays | 19 |
| Receiving Yards Per Game | 253.5 |
| Receiving Fumbles | 3 |
| Receiving Fumbles Lost | 2 |
| Receiving Yards After Catch | 744 |
| Receiving First Downs | 72 |
| Team Games Played | 6 |
| Yards Per Reception | 12.4 |
| Total Points Per Game | 27.0 |
| Total Points | 162 |
| Total Touchdowns | 20 |
Miscellaneous
| Total 1st downs | 127 |
| Rushing 1st downs | 43 |
| Passing 1st downs | 72 |
| 1st downs by penalty | 12 |
| Third Down Conversions | 31 |
| Third Down Attempts | 75 |
| 3rd down % | 41.33 |
| Fourth Down Conversions | 3 |
| First Downs Attempts | 6 |
| 4th down % | 50.00 |
| Total Penalties | 52 |
| Total Penalty Yards | 394 |
| Possession Time Seconds | 10825 |
| Red Zone Field Goal Percentage | 21.74 |
| Red Zone Scoring Percentage | 95.65 |
| Red Zone Efficiency Percentage | 83.23 |
| Red Zone Touchdown Percentage | 73.91 |
| Total Takeaways | 8 |
| Total Giveaways | 10 |
| Turnover Ratio | -2 |
| Fumbles Lost | 6 |
| 3rd down efficiency | 31-75 |
| 4th down efficiency | 3-6 |
| Total-Yards | 52-394 |
Defense
| Solo Tackles | 215 |
| Assist Tackles | 211 |
| Total Tackles | 426 |
| Sacks | 8 |
| Sack Yards | 49 |
| Stuffs | 37 |
| Passes Defended | 34 |
| Average Interception Yards | 4.2 |
| Long Interception | 14 |
| Miscellaneous Touchdowns | 0 |
| Kicks Blocked | 0 |
| Tackles For Loss | 34 |
| Team Games Played | 6 |
Defensive Interceptions
| Interceptions | 5 |
| Interception Yards | 21 |
| Interception Touchdowns | 0 |
| INT: Total | 5-21 |
General
| Fumbles | 14 |
| Forced Fumbles | 10 |
| Fumbles Recovered | 3 |
| Fumbles Touchdowns | 0 |
| Games Played | 6 |
| Fumbles-Lost | 14-6 |
Returning
| Kick Returns | 26 |
| Kick Return Yards | 648 |
| Yards Per Kick Return | 24.9 |
| Long Kick Return | 79 |
| Kick Return Touchdowns | 0 |
| Punt Returns | 9 |
| Punt Return Yards | 121 |
| Yards Per Punt Return | 13.4 |
| Long Punt Return | 27 |
| Punt Return Touchdowns | 0 |
| Punt Return Fair Catches | 4 |
| Kick Return Fumbles Lost | 0 |
| Punt Return Fumbles Lost | 0 |
| Team Games Played | 6 |
| Punt: Total | 9-121 |
Kicking
| Field Goal Made | 8 |
| Field Goal Attempts | 10 |
| Field Goal Percentage | 80.0 |
| Long Field Goal Made | 47 |
| Field Goal Attempts 1-19 | 0 |
| Field Goal Attempts 20-29 | 3 |
| Field Goal Attempts 30-39 | 2 |
| Field Goal Attempts 40-49 | 4 |
| Field Goal Attempts 50+ | 1 |
| Extra Points Made | 18 |
| Extra Point Attempts | 19 |
| Extra Point Percentage | 94.7 |
| Field Goals Made 1-19 | 0 |
| Field Goals Made 20-29 | 3 |
| Field Goals Made 30-39 | 2 |
| Field Goals Made 40-49 | 3 |
| Field Goals Made 50+ | 0 |
| Total Kicking Points | 42 |
| Team Games Played | 6 |
| Touchback Percentage | 18 |
| Average Kickoff Return Yards | 27.5 |
| Kickoff Return Yards | 714 |
| Kickoff Returns | 26 |
| Kickoffs: Total | 26-714 |
| FG: Good-Attempts | 8-10 |
Punting
| Punts | 21 |
| Punt Yards | 987 |
| Long Punt | 59 |
| Gross Average Punt Yards | 47.0 |
| Net Average Punt Yards | 42.9 |
| Punts Blocked | 0 |
| Punts Inside 20 | 12 |
| Touchbacks | 0 |
| Fair Catches | 10 |
| Punt Returns | 6 |
| Punt Return Yards | 86 |
| Average Punt Return Yards | 14.3 |
| Team Games Played | 6 |
| Punt: Total Yards | 21-987 |
Scoring
| Rushing Touchdowns | 7 |
| Receiving Touchdowns | 13 |
| Return Touchdowns | 0 |
| Total Touchdowns | 20 |
| Field Goals | 8 |
| Kick Extra Points | 18 |
| Total Two Point Conversions | 0 |
| Total Points | 162 |
| Total Points Per Game | 27.0 |


