
Recent Results
| Date | Matchup | Result / Time |
|---|---|---|
| Oct 18, 2026 | Carolina Panthers @ Philadelphia Eagles | Sun, Oct 18 1:00 PM ET |
| Oct 4, 2026 | Carolina Panthers vs Detroit Lions | Sun, Oct 4 8:20 PM ET |
| Sep 27, 2026 | Carolina Panthers @ Cleveland Browns | Sun, Sep 27 1:00 PM ET |
Upcoming Games
| Date | Matchup | Result / Time |
|---|---|---|
| Oct 25, 2026 | Carolina Panthers vs Tampa Bay Buccaneers | Sun, Oct 25 1:00 PM ET |
| Oct 29, 2026 | Carolina Panthers @ Green Bay Packers | Thu, Oct 29 8:15 PM ET |
| Nov 8, 2026 | Carolina Panthers vs Denver Broncos | Sun, Nov 8 1:00 PM ET |

Carolina Panthers
3-2
🏟 Bank of America Stadium
Division Standings
| Team | W | L | T | PCT | DIV | PF | PA | STRK |
|---|---|---|---|---|---|---|---|---|
| San Francisco 49ers | 6 | 0 | 0 | 1.000 | - | 177 | 110 | W6 |
| Minnesota Vikings | 5 | 0 | 0 | 1.000 | - | 109 | 64 | W5 |
| Chicago Bears | 5 | 2 | 0 | .714 | - | 180 | 143 | W2 |
| Green Bay Packers | 4 | 2 | 0 | .667 | - | 127 | 125 | W3 |
| Carolina Panthers | 3 | 2 | 0 | .600 | - | 146 | 123 | W2 |
| Detroit Lions | 3 | 2 | 0 | .600 | - | 164 | 148 | W1 |
| New York Giants | 3 | 2 | 1 | .583 | - | 136 | 140 | L1 |
| Seattle Seahawks | 3 | 3 | 0 | .500 | - | 148 | 122 | L2 |
| Atlanta Falcons | 2 | 4 | 0 | .333 | - | 142 | 153 | L2 |
| New Orleans Saints | 2 | 4 | 0 | .333 | - | 152 | 178 | W1 |
| Philadelphia Eagles | 2 | 4 | 0 | .333 | - | 106 | 137 | L4 |
| Dallas Cowboys | 2 | 4 | 0 | .333 | - | 151 | 159 | L2 |
| Arizona Cardinals | 2 | 4 | 0 | .333 | - | 126 | 178 | W1 |
| Los Angeles Rams | 2 | 4 | 0 | .333 | - | 135 | 138 | L2 |
| Washington Commanders | 1 | 4 | 1 | .250 | - | 132 | 172 | L1 |
| Tampa Bay Buccaneers | 1 | 5 | 0 | .167 | - | 119 | 138 | L1 |
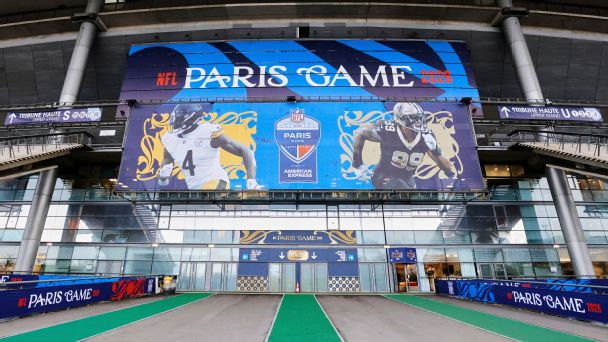
Week 7 NFL highlights: Best plays, moments, touchdowns, more
Check here for Sunday's top moments, starting with Aaron Rodgers, Jaylen Warren, Tyler Shough and Alvin Kamara in France.
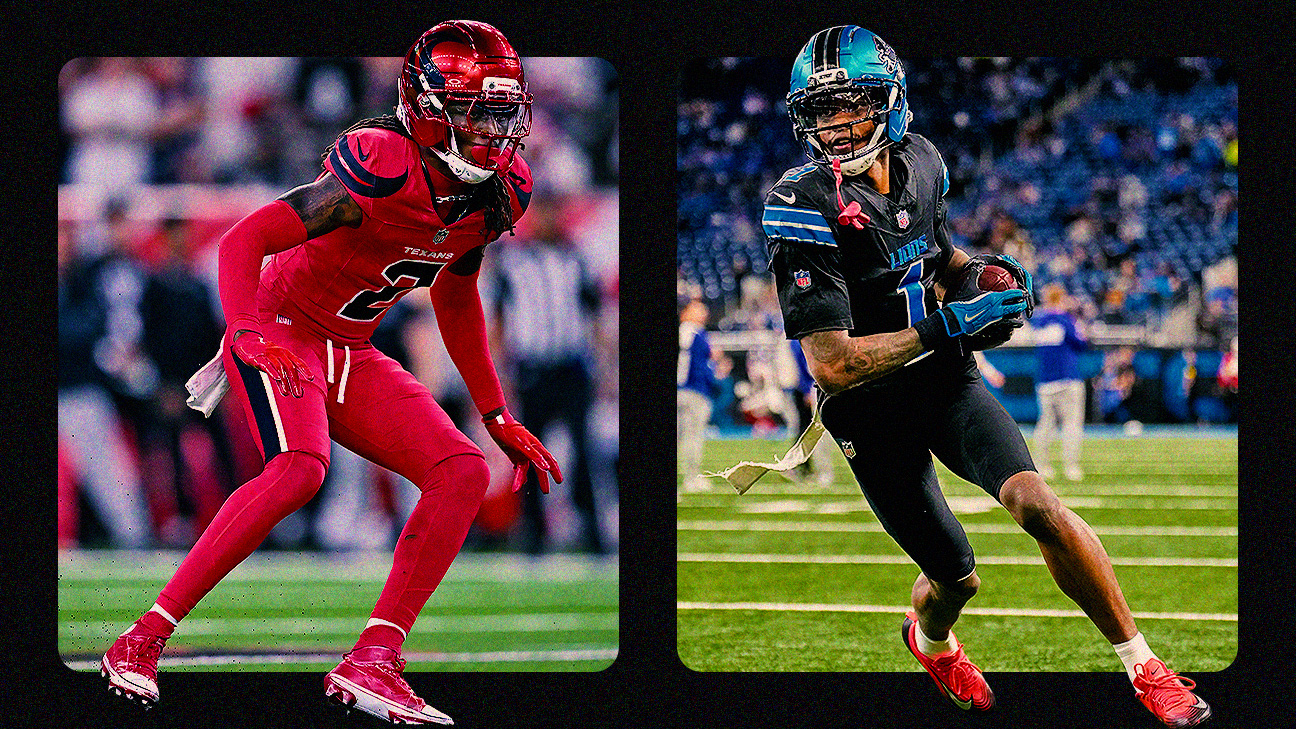
NFL Week 7 uniforms: Alternates galore as Texans go battle red, Lions all-black
Here's a look at what each NFL team is wearing in Week 7, led by alternate looks from Houston, Detroit and Dallas.
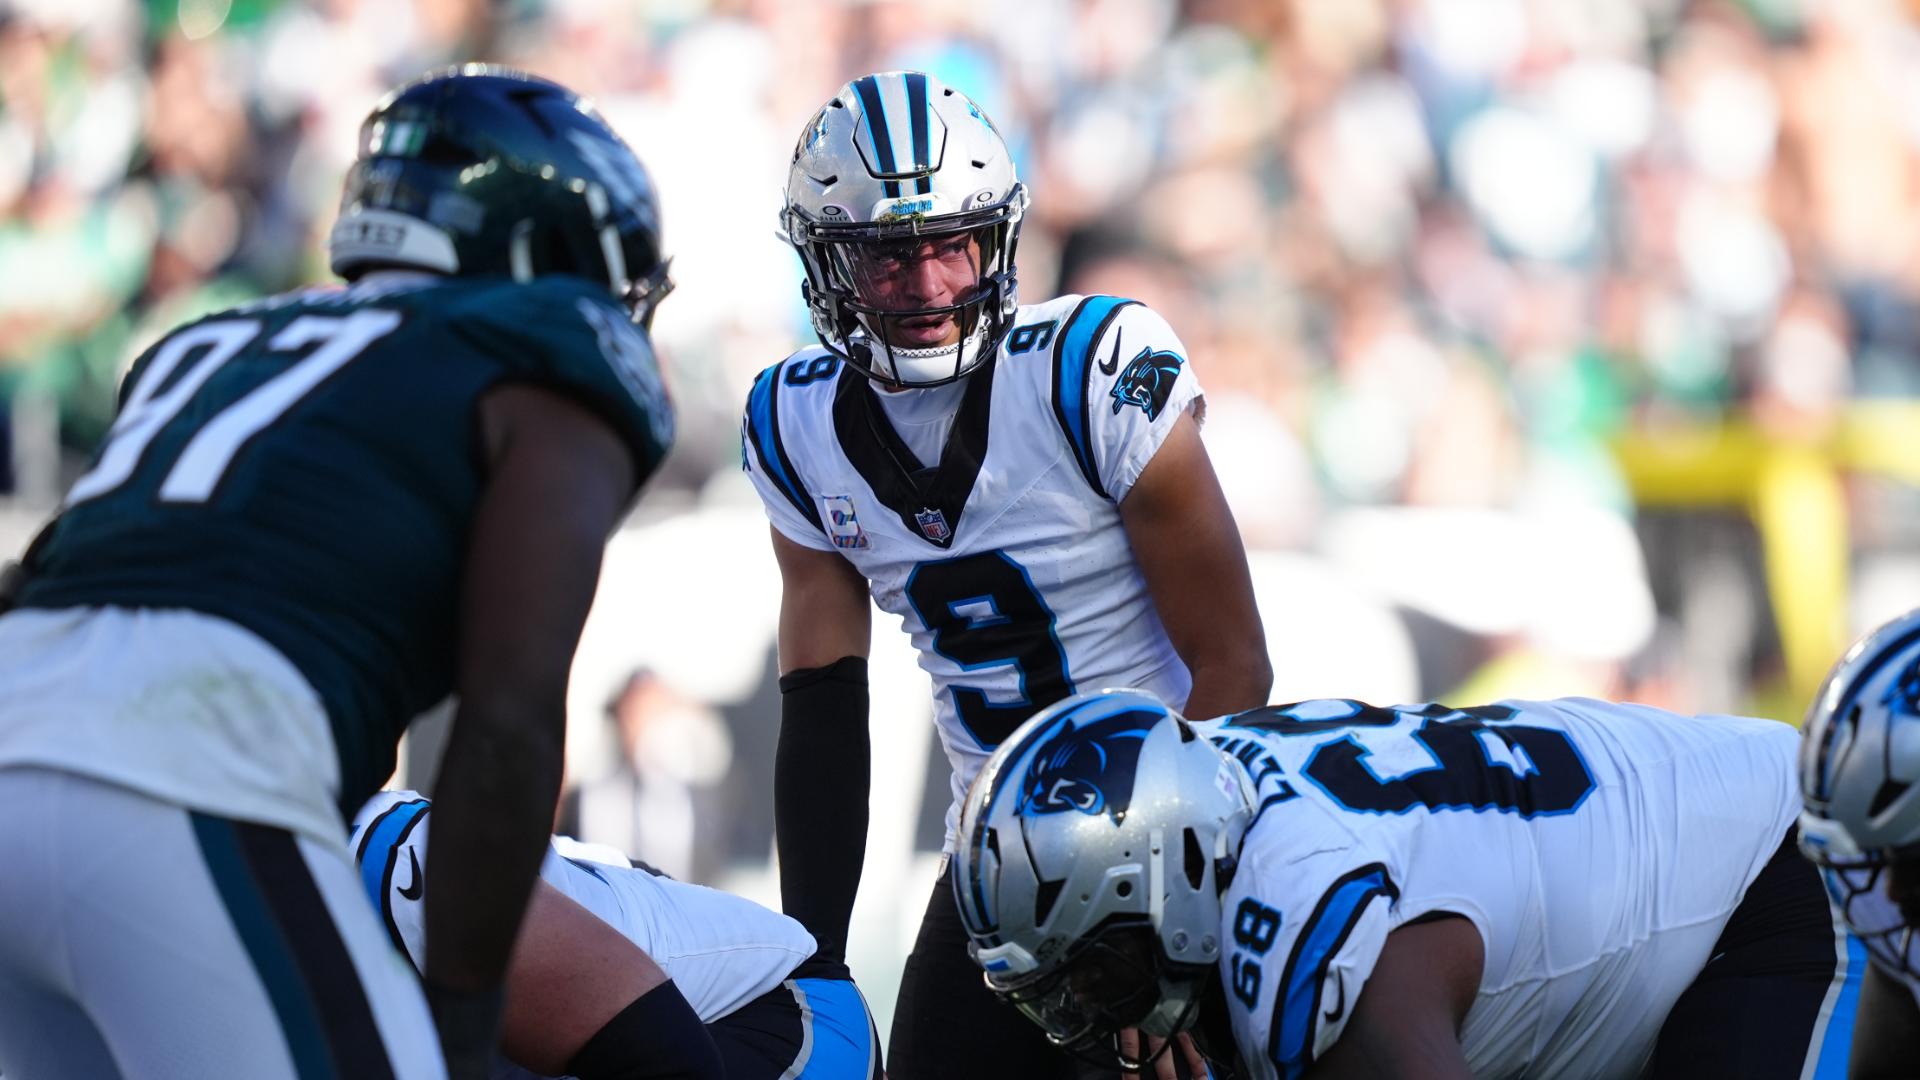
Panthers look to establish run game against Bucs
Mike Kay reports Carolina faces a tough test against Tampa Bay's run defense.
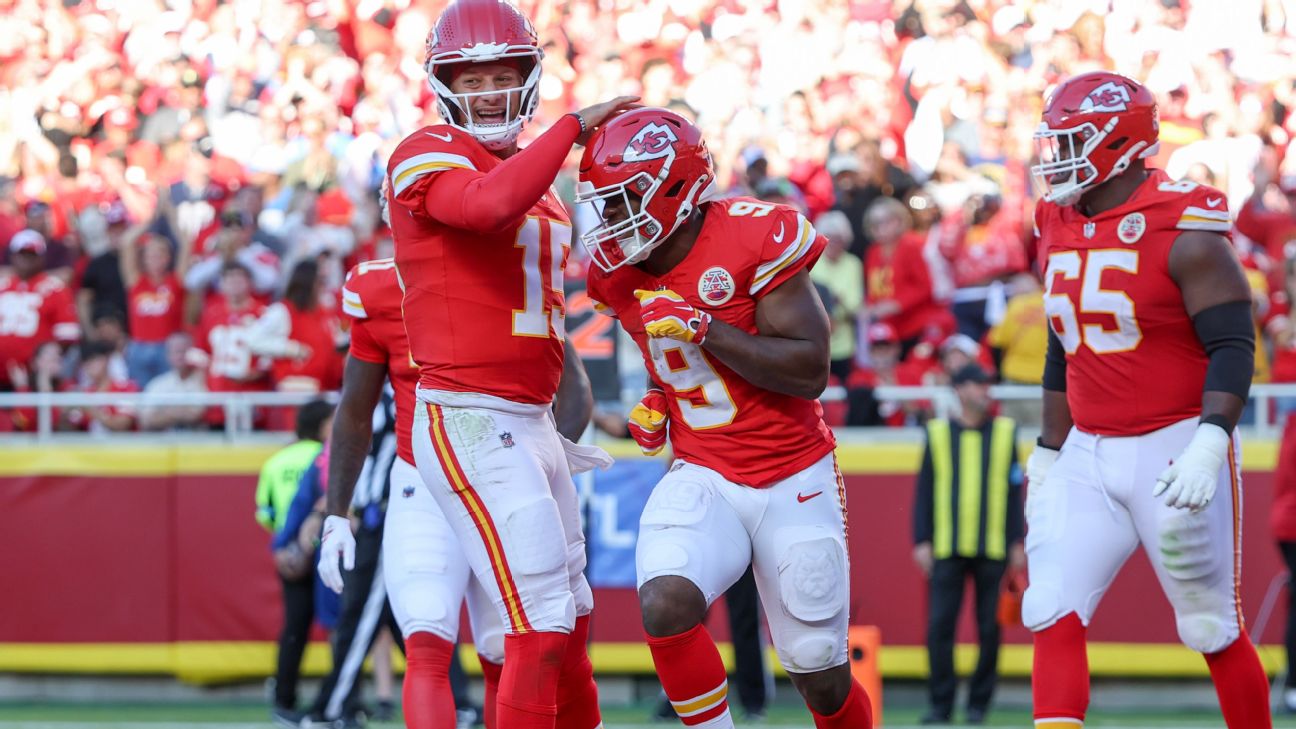
NFL Week 7 betting odds: Lines and totals for every game
A look at the odds, spreads, totals and FPI predictions for every NFL game in Week 7.
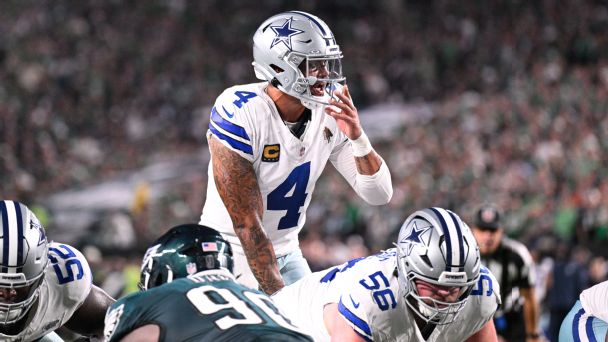
NFL Week 7 preview: Picks, predictions, schedule, betting odds, fantasy tips
Cowboys at Eagles? Bengals at Ravens? The Steelers and Saints in Paris? There are 13 more games in Week 7, and we have picks, predictions and more for all of them.
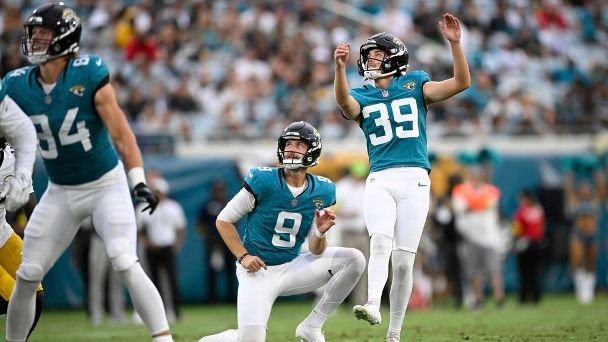
What are the longest field goals in NFL history?
Timely field goals can change game trajectories in a dramatic fashion. Check out the longest field goals in NFL history now.

Baker Mayfield set to make return vs. Panthers, looks to turn around struggling Buccaneers
— The last-place Tampa Bay Buccaneers are in need of a spark.
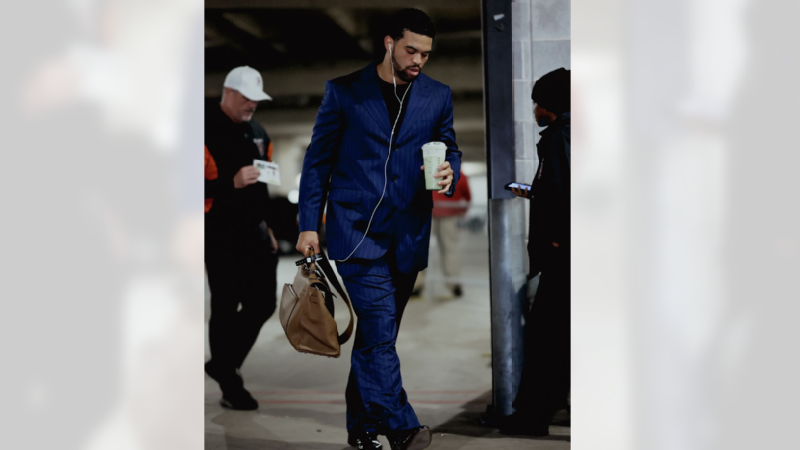
Bears QB Caleb Williams leads NFL Week 7's best arrivals
NFL stars continue to turn game-day arrivals into their own weekly fashion showcase.
| Date | Matchup | Result / Time |
|---|---|---|
| Sep 13, 2026 | Carolina Panthers vs Chicago Bears | Sun, Sep 13 1:00 PM ET |
| Sep 20, 2026 | Carolina Panthers @ Atlanta Falcons | Sun, Sep 20 1:00 PM ET |
| Sep 27, 2026 | Carolina Panthers @ Cleveland Browns | Sun, Sep 27 1:00 PM ET |
| Oct 4, 2026 | Carolina Panthers vs Detroit Lions | Sun, Oct 4 8:20 PM ET |
| Oct 18, 2026 | Carolina Panthers @ Philadelphia Eagles | Sun, Oct 18 1:00 PM ET |
| Oct 25, 2026 | Carolina Panthers vs Tampa Bay Buccaneers | Sun, Oct 25 1:00 PM ET |
| Oct 29, 2026 | Carolina Panthers @ Green Bay Packers | Thu, Oct 29 8:15 PM ET |
| Nov 8, 2026 | Carolina Panthers vs Denver Broncos | Sun, Nov 8 1:00 PM ET |
| Nov 15, 2026 | Carolina Panthers @ New Orleans Saints | Sun, Nov 15 1:00 PM ET |
| Nov 22, 2026 | Carolina Panthers vs Baltimore Ravens | Sun, Nov 22 1:00 PM ET |
| Nov 30, 2026 | Carolina Panthers @ Tampa Bay Buccaneers | Mon, Nov 30 8:15 PM ET |
| Dec 6, 2026 | Carolina Panthers @ Minnesota Vikings | Sun, Dec 6 4:25 PM ET |
| Dec 13, 2026 | Carolina Panthers vs New Orleans Saints | Sun, Dec 13 1:00 PM ET |
| Dec 20, 2026 | Carolina Panthers vs Cincinnati Bengals | Sun, Dec 20 1:00 PM ET |
| Dec 27, 2026 | Carolina Panthers @ Pittsburgh Steelers | Sun, Dec 27 12:00 AM ET |
| Jan 3, 2027 | Carolina Panthers vs Seattle Seahawks | Sun, Jan 3 1:00 PM ET |
| Jan 10, 2027 | Carolina Panthers vs Atlanta Falcons | Sun, Jan 10 12:00 AM ET |
Roster
| Player | No | Pos | Status | Height | Weight | Experience | College |
|---|---|---|---|---|---|---|---|
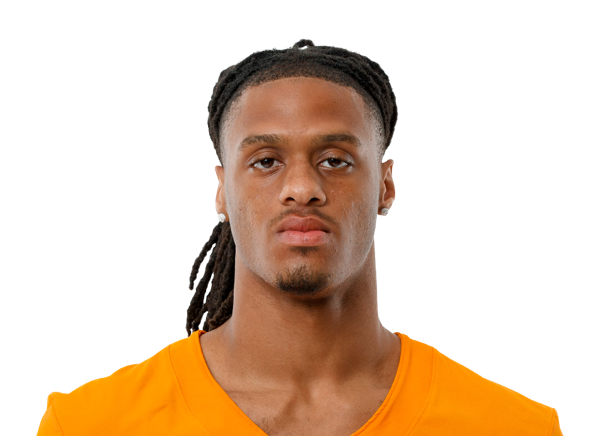 Chris Brazzell II |
19 | WR | Day-To-Day | 6' 4" | 198 lbs | R | Tennessee |
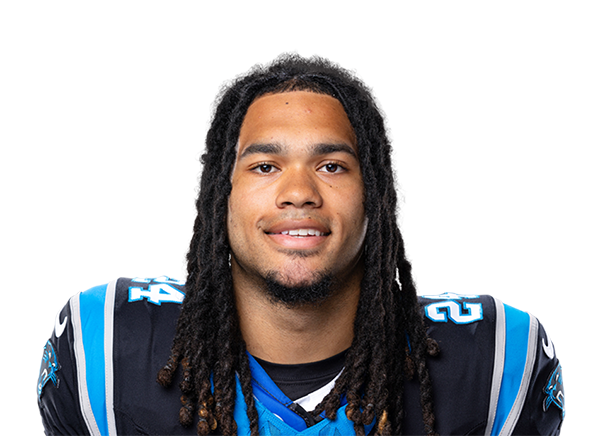 Jonathon Brooks |
25 | RB | Day-To-Day | 6' 0" | 207 lbs | 3 | Texas |
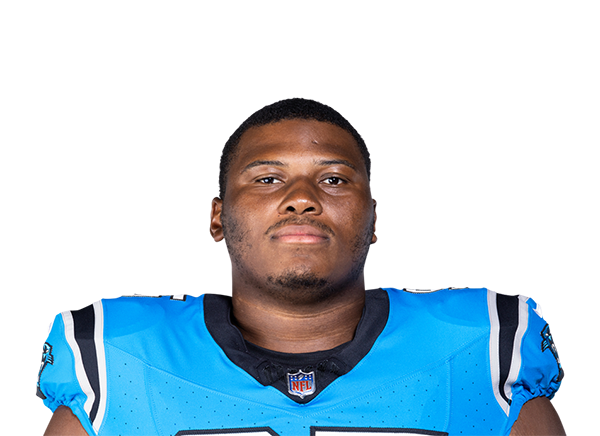 Derrick Brown |
95 | DT | Active | 6' 5" | 320 lbs | 7 | Auburn |
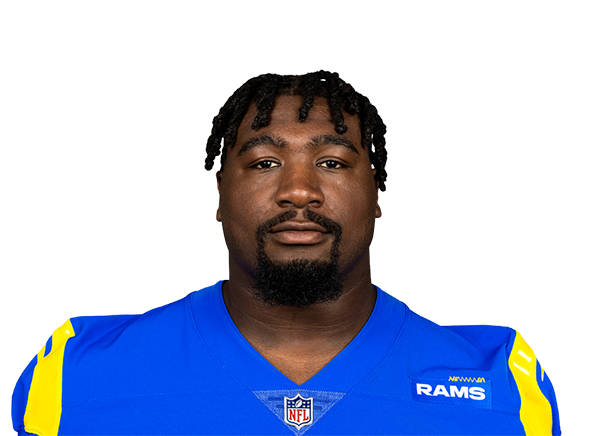 Bobby Brown III |
97 | DT | Active | 6' 4" | 332 lbs | 6 | Texas A&M |
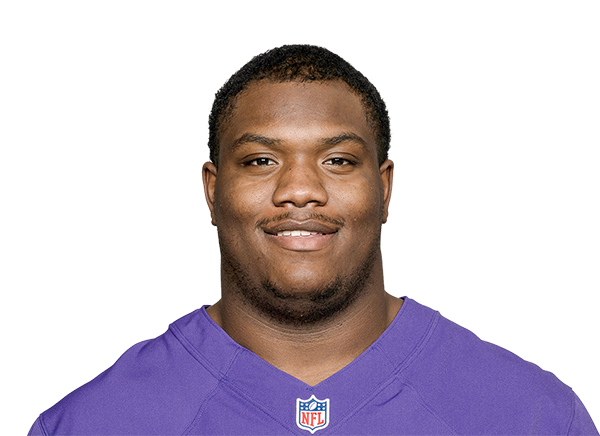 Corey Bullock |
67 | C | Active | 6' 3" | 320 lbs | 2 | Maryland |
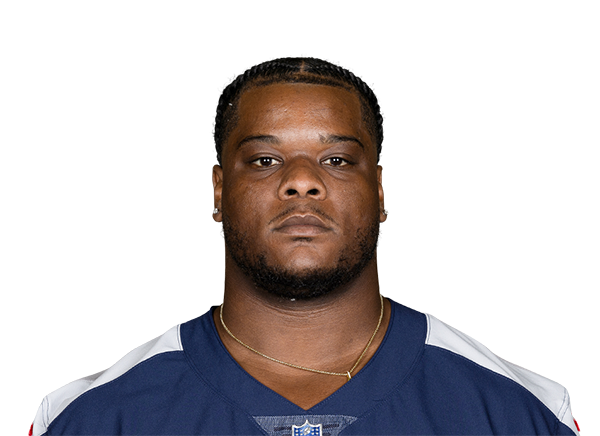 Saahdiq Charles |
78 | G | Practice Squad | 6' 4" | 321 lbs | 5 | LSU |
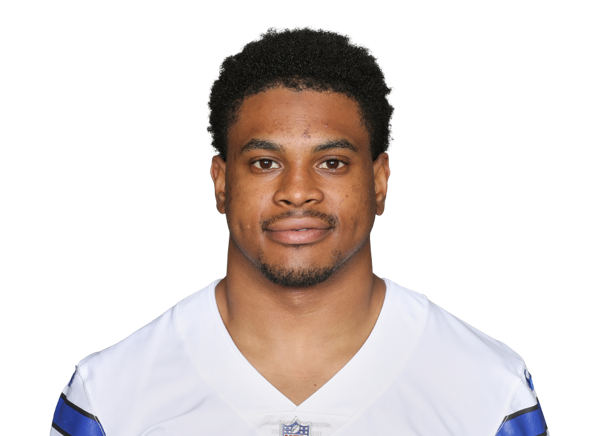 Zion Childress |
- | CB | Practice Squad | 5' 11" | 203 lbs | 1 | Kentucky |
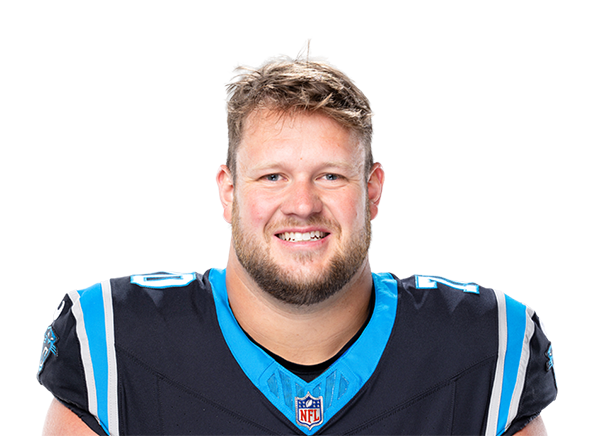 Brady Christensen |
70 | G | Day-To-Day | 6' 6" | 300 lbs | 6 | BYU |
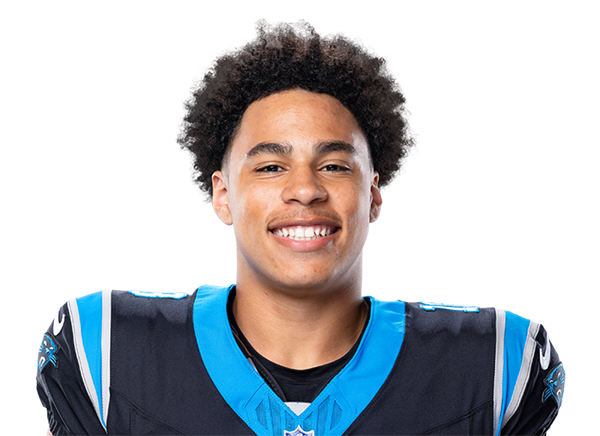 Jalen Coker |
18 | WR | Active | 6' 3" | 215 lbs | 3 | Holy Cross |
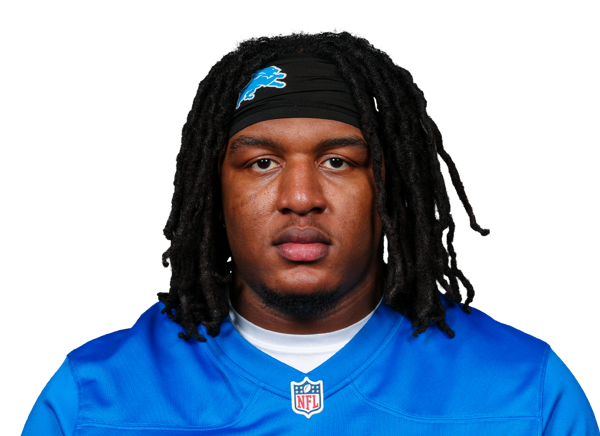 Keith Cooper Jr. |
- | DT | Practice Squad | 6' 5" | 280 lbs | 1 | Houston |
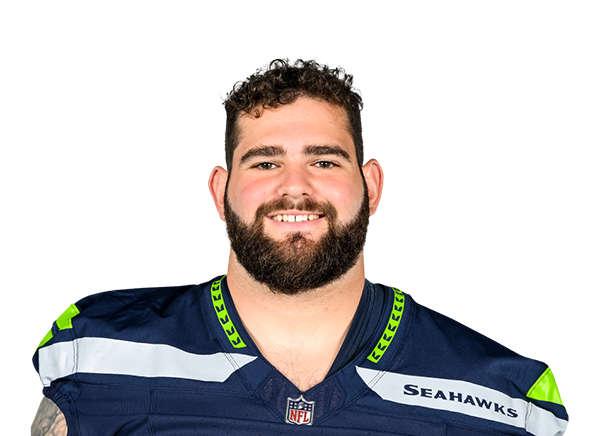 Jake Curhan |
71 | OT | Practice Squad | 6' 6" | 316 lbs | 6 | California |
 Malcolm DeWalt IV |
36 | DB | Practice Squad | 6' 2" | 190 lbs | R | Akron |
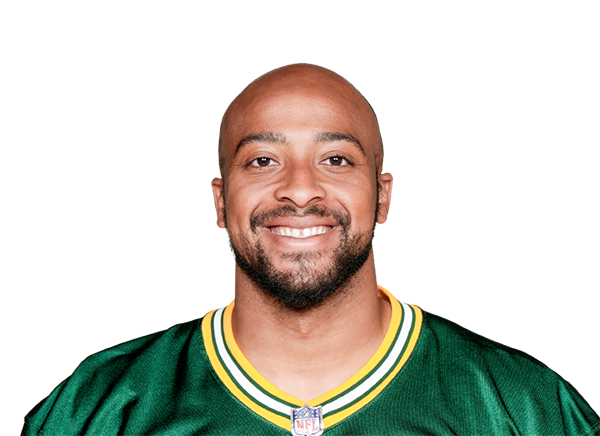 AJ Dillon |
28 | RB | Active | 6' 0" | 247 lbs | 7 | Boston College |
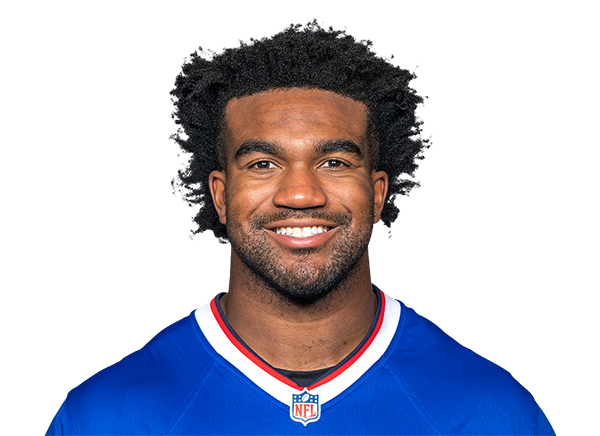 Tyrel Dodson |
33 | LB | Active | 6' 0" | 237 lbs | R | Texas A&M |
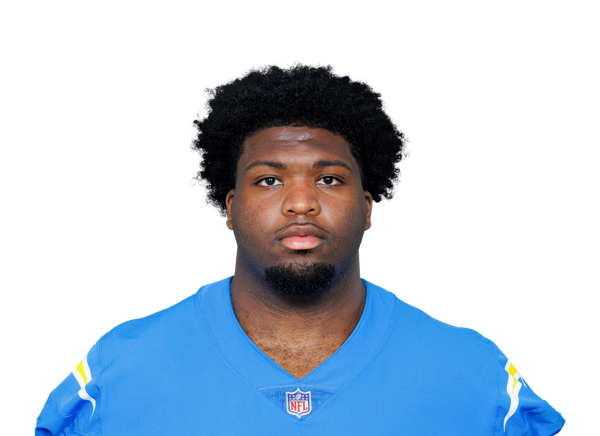 TeRah Edwards |
93 | DT | Active | 6' 2" | 305 lbs | 1 | Illinois |
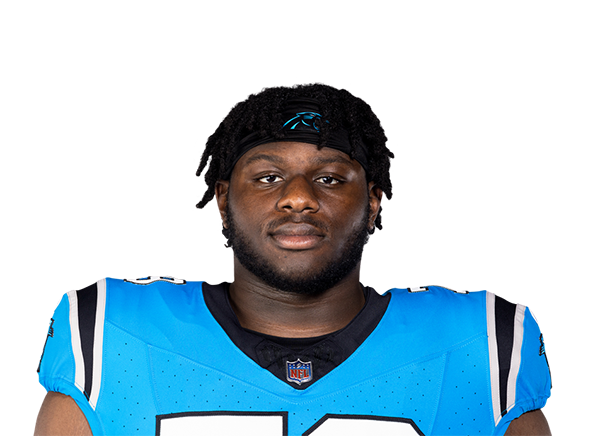 Ikem Ekwonu |
79 | OT | Day-To-Day | 6' 4" | 320 lbs | 5 | NC State |
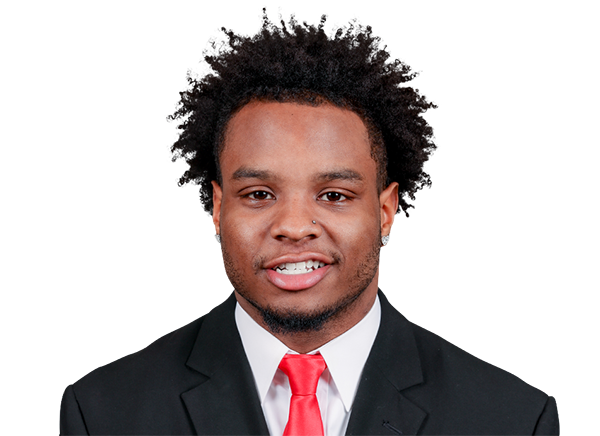 Trevor Etienne |
23 | RB | Active | 5' 8" | 198 lbs | 2 | Georgia |
 Mitchell Evans |
84 | TE | Active | 6' 5" | 258 lbs | 2 | Notre Dame |
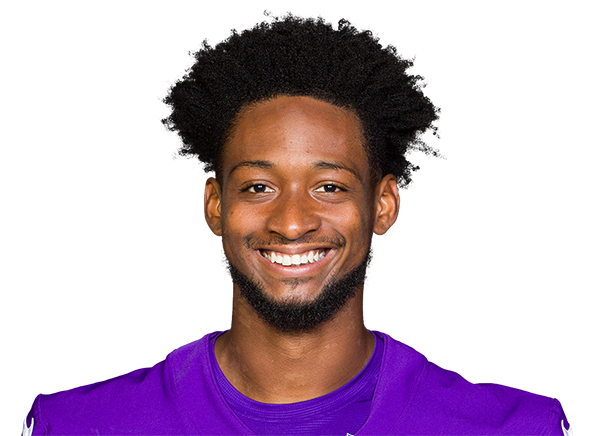 Akayleb Evans |
29 | CB | Active | 6' 2" | 198 lbs | 5 | Missouri |
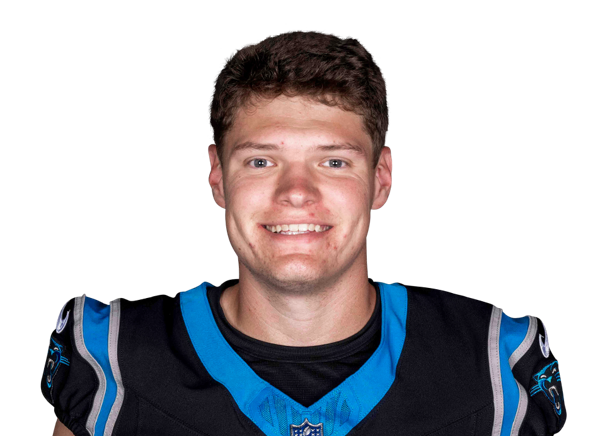 Ryan Fitzgerald |
10 | PK | Active | 5' 11" | 193 lbs | 2 | Florida State |
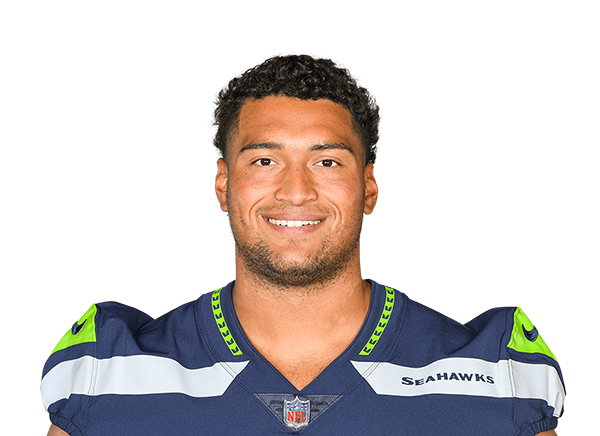 Stone Forsythe |
73 | OT | Active | 6' 8" | 307 lbs | 6 | Florida |
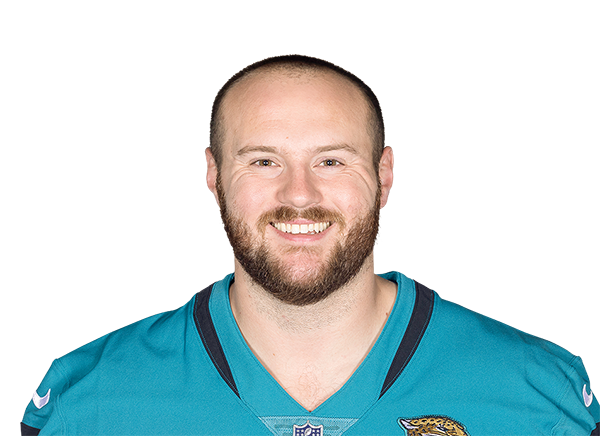 Luke Fortner |
77 | C | Active | 6' 6" | 300 lbs | 5 | Kentucky |
 Feleipe Franks |
81 | TE | Active | 6' 6" | 228 lbs | 4 | Arkansas |
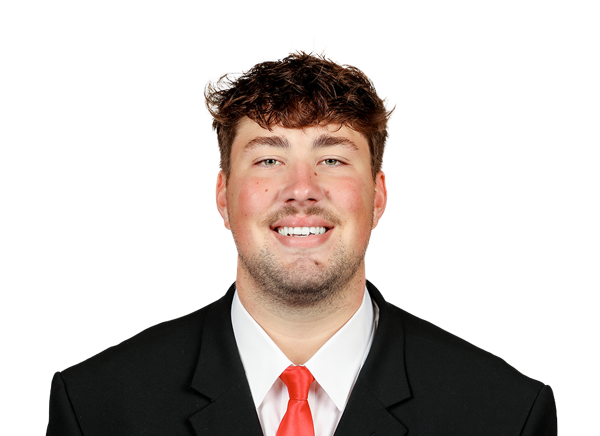 Monroe Freeling |
57 | OT | Active | 6' 7" | 315 lbs | R | Georgia |
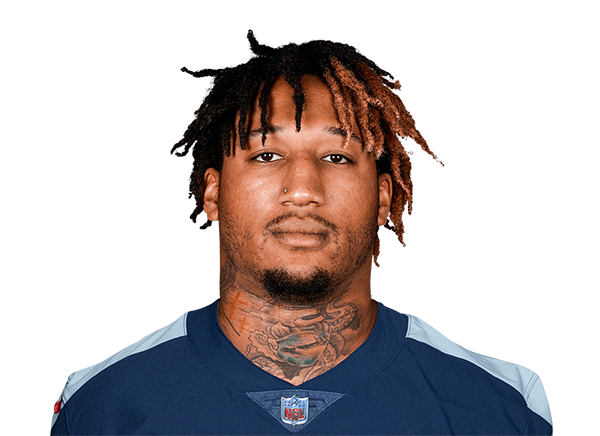 Trevis Gipson |
52 | LB | Active | 6' 4" | 255 lbs | 7 | Tulsa |
 Aaron Hall |
94 | DT | Active | 6' 4" | 297 lbs | R | Duke |
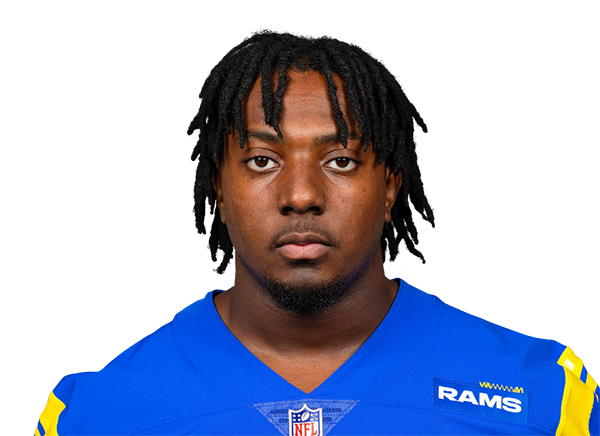 Nick Hampton |
39 | LB | Active | 6' 3" | 235 lbs | 4 | App State |
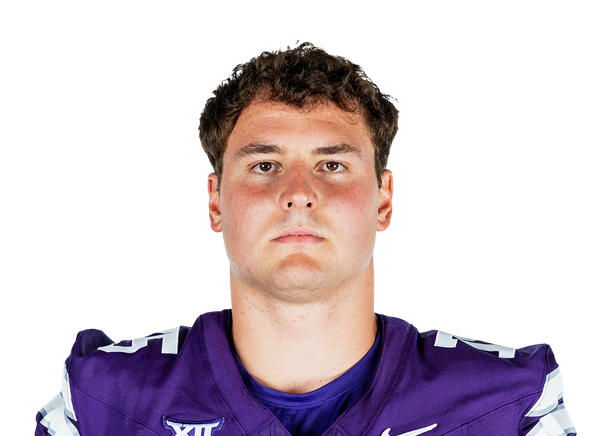 Sam Hecht |
75 | C | Active | 6' 4" | 303 lbs | R | Kansas State |
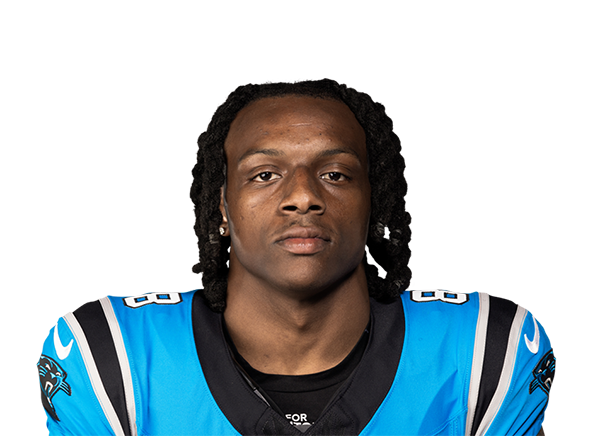 Jaycee Horn |
8 | CB | Day-To-Day | 6' 1" | 200 lbs | 6 | South Carolina |
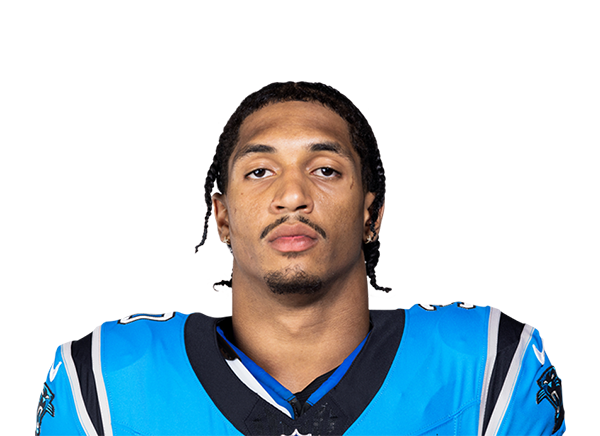 Chuba Hubbard |
30 | RB | Active | 6' 1" | 210 lbs | 6 | Oklahoma State |
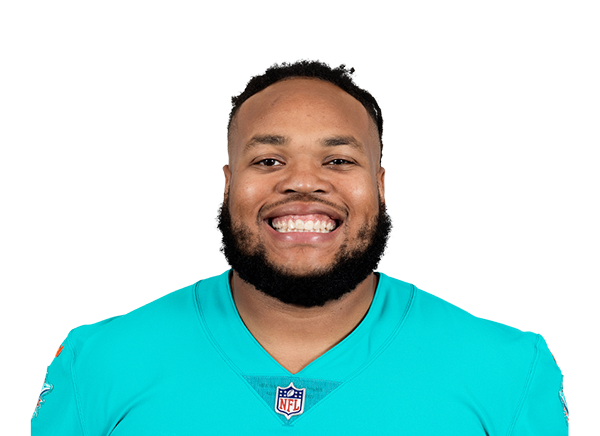 Robert Hunt |
50 | G | Active | 6' 6" | 323 lbs | 7 | Louisiana |
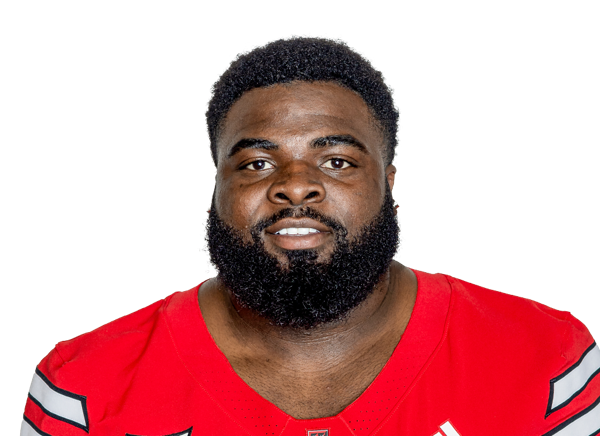 Lee Hunter |
92 | DT | Active | 6' 3" | 318 lbs | R | Texas Tech |
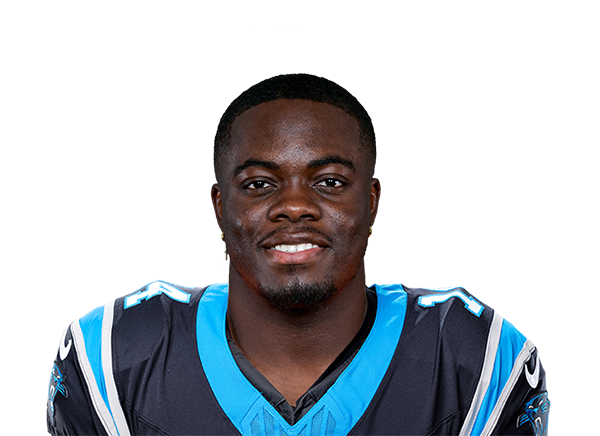 Thomas Incoom |
48 | LB | Day-To-Day | 6' 2" | 265 lbs | 4 | Central Michigan |
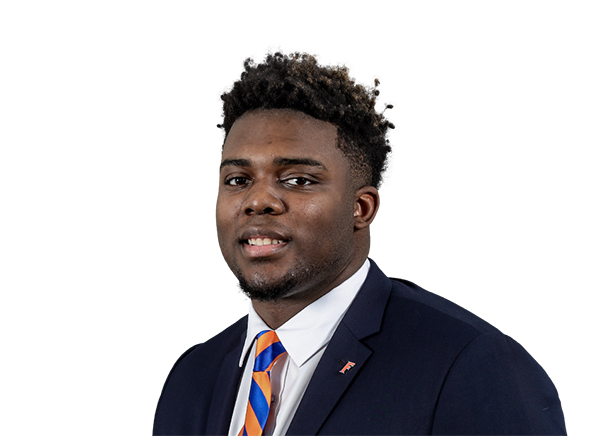 Cam Jackson |
99 | DT | Day-To-Day | 6' 6" | 328 lbs | 2 | Florida |
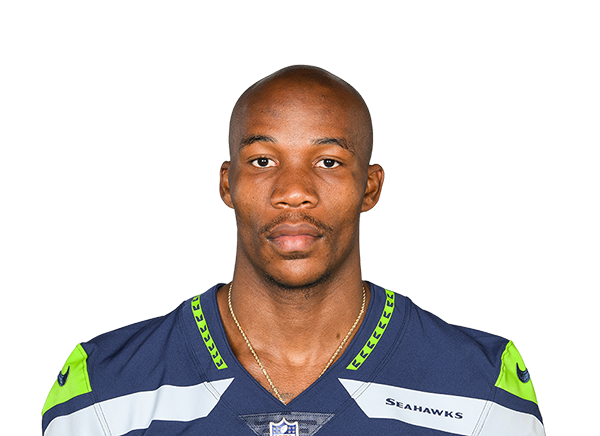 Mike Jackson |
2 | CB | Day-To-Day | 6' 1" | 210 lbs | 6 | Miami |
 JJ Jansen |
44 | LS | Active | 6' 2" | 235 lbs | 19 | Notre Dame |
 Patrick Jones II |
91 | LB | Active | 6' 4" | 264 lbs | 6 | Pittsburgh |
 Haynes King |
16 | QB | Active | 6' 2" | 212 lbs | R | Georgia Tech |
 Jackson Kuwatch |
46 | LB | Active | 6' 4" | 232 lbs | R | Miami (OH) |
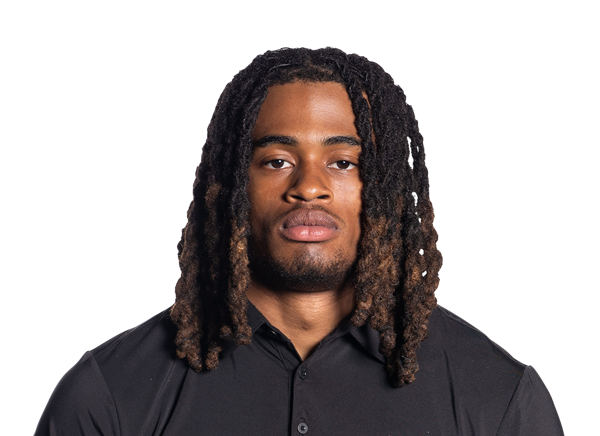 Will Lee III |
24 | CB | Active | 6' 1" | 189 lbs | R | Texas A&M |
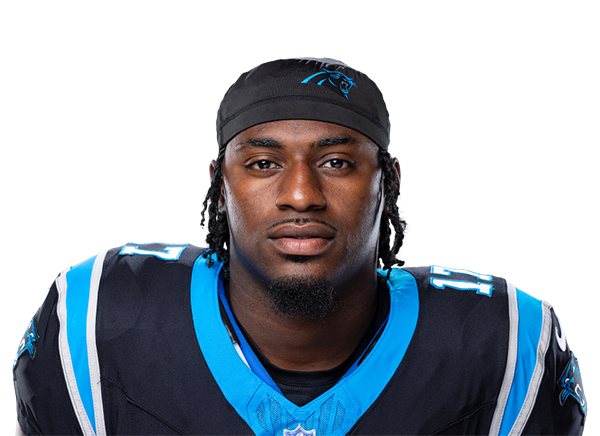 Xavier Legette |
17 | WR | Day-To-Day | 6' 3" | 227 lbs | 3 | South Carolina |
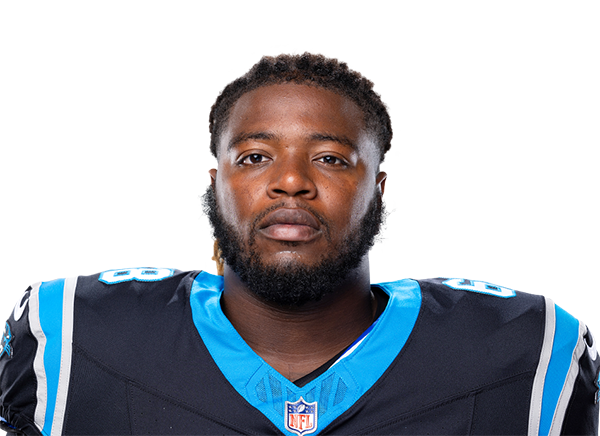 Damien Lewis |
68 | G | Active | 6' 2" | 327 lbs | 7 | LSU |
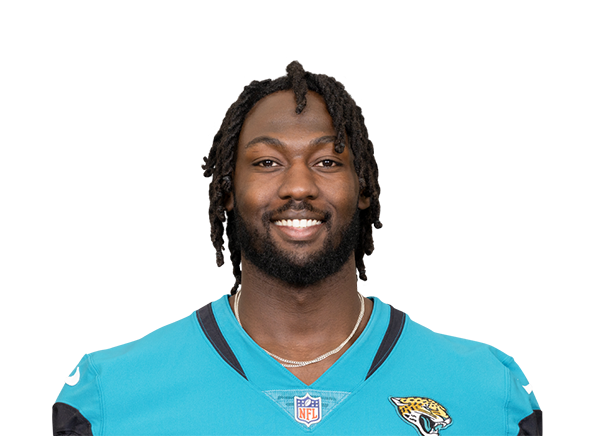 Devin Lloyd |
55 | LB | Active | 6' 3" | 235 lbs | 5 | Utah |
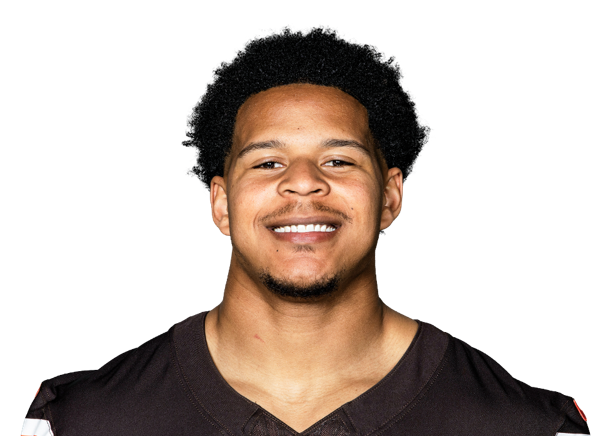 Ahmani Marshall |
- | RB | Practice Squad | 6' 1" | 225 lbs | R | App State |
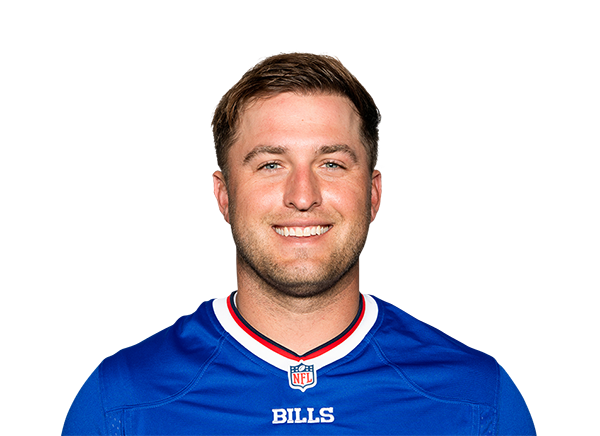 Sam Martin |
6 | P | Active | 6' 1" | 205 lbs | 14 | App State |
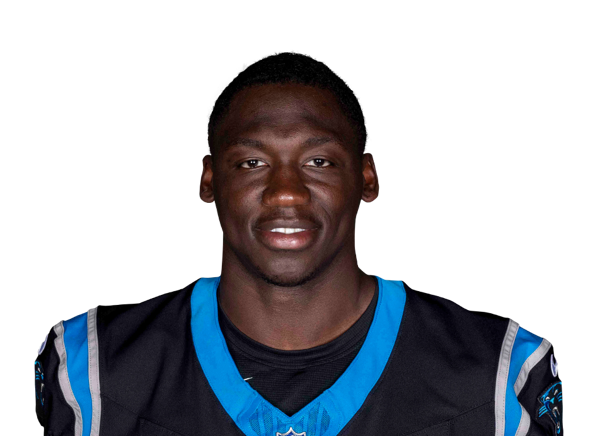 Bam Martin-Scott |
54 | LB | Day-To-Day | 6' 2" | 231 lbs | 2 | South Carolina |
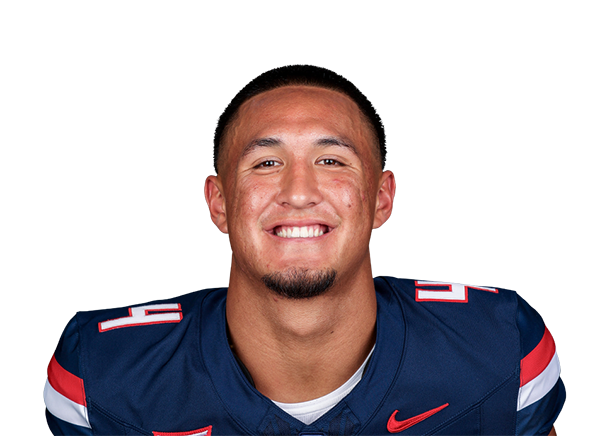 Tetairoa McMillan |
4 | WR | Active | 6' 5" | 212 lbs | 2 | Arizona |
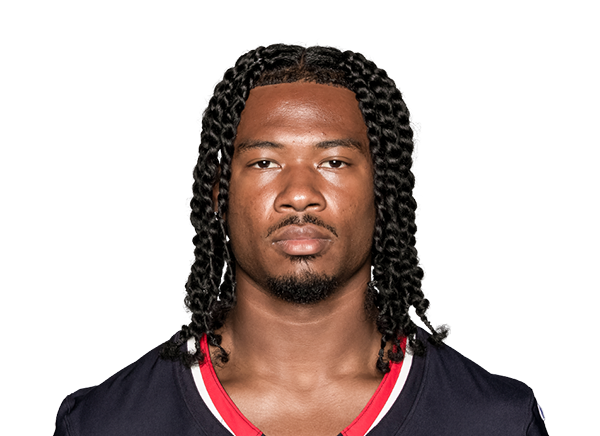 John Metchie III |
13 | WR | Active | 5' 11" | 187 lbs | 4 | Alabama |
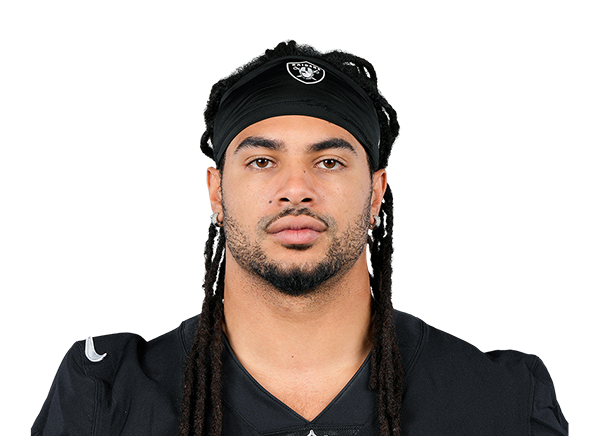 Tre'von Moehrig |
7 | S | Active | 6' 2" | 202 lbs | 6 | TCU |
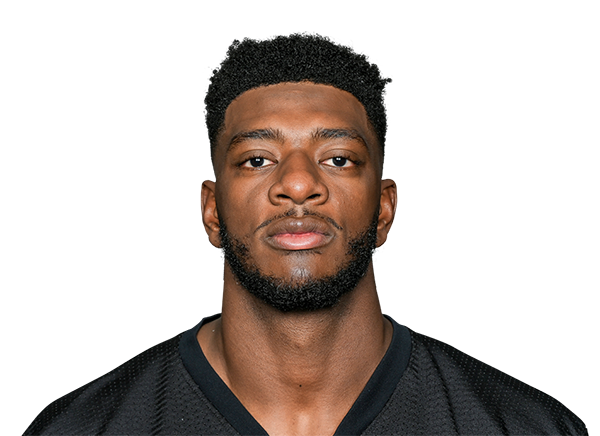 Jeremiah Moon |
56 | LB | Active | 6' 5" | 247 lbs | 3 | Florida |
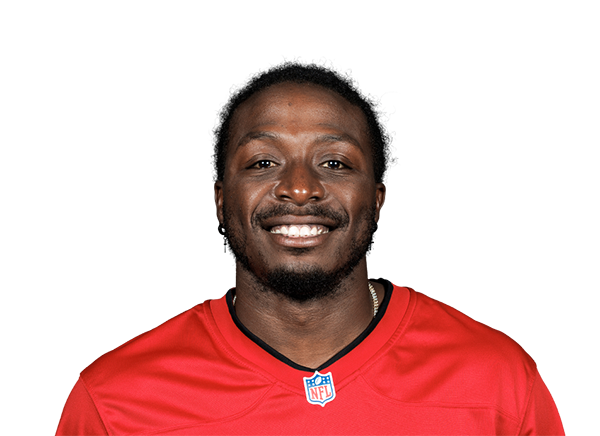 David Moore |
83 | WR | Active | 6' 0" | 220 lbs | 8 | East Central |
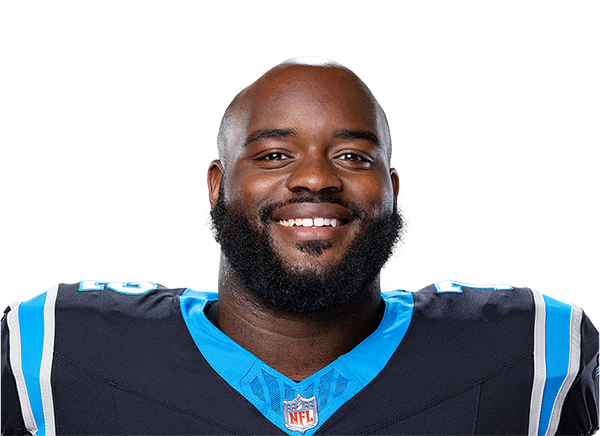 Taylor Moton |
72 | OT | Active | 6' 5" | 325 lbs | 10 | Western Michigan |
 Mapalo Mwansa |
58 | LB | Practice Squad | 6' 2" | 230 lbs | 1 | - |
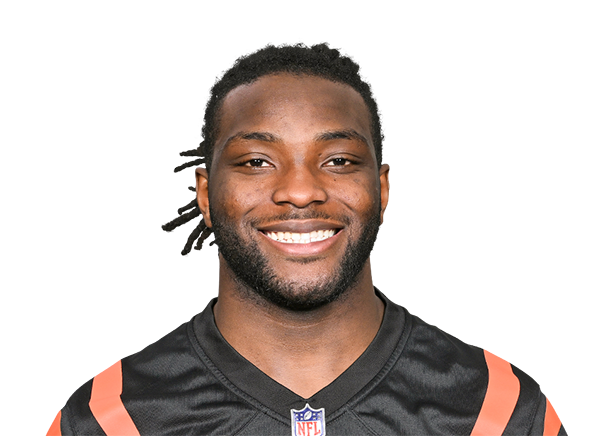 Maema Njongmeta |
45 | LB | Practice Squad | 6' 0" | 230 lbs | 3 | Wisconsin |
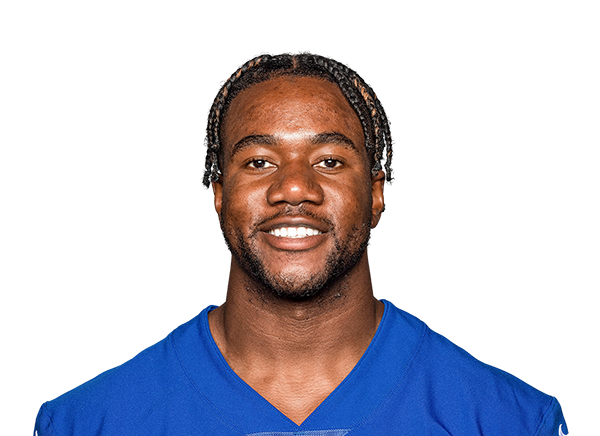 Bobby Okereke |
58 | LB | Active | 6' 2" | 235 lbs | 7 | Stanford |
 Parker Petersen |
69 | DT | Practice Squad | 6' 4" | 314 lbs | R | Wisconsin |
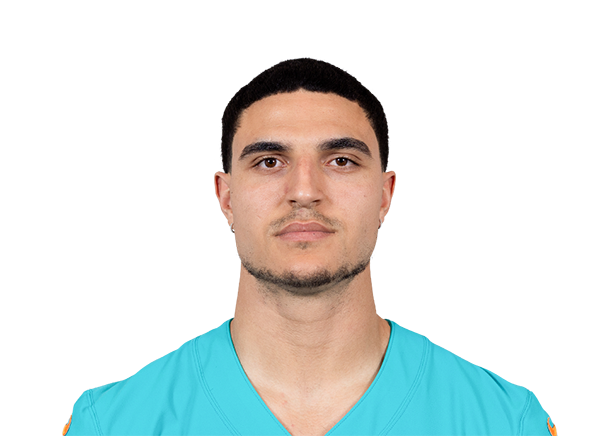 Jaelan Phillips |
5 | LB | Active | 6' 5" | 266 lbs | 6 | Miami |
 Kenny Pickett |
12 | QB | Active | 6' 3" | 220 lbs | 5 | Pittsburgh |
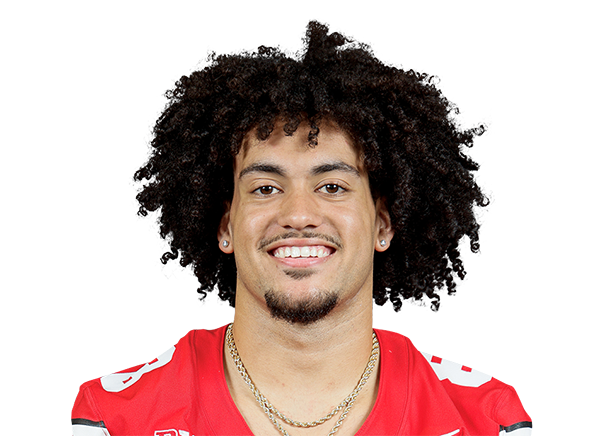 Lathan Ransom |
22 | S | Active | 6' 0" | 206 lbs | 2 | Ohio State |
 Ja'seem Reed |
86 | WR | Active | 6' 2" | 195 lbs | 1 | San Diego |
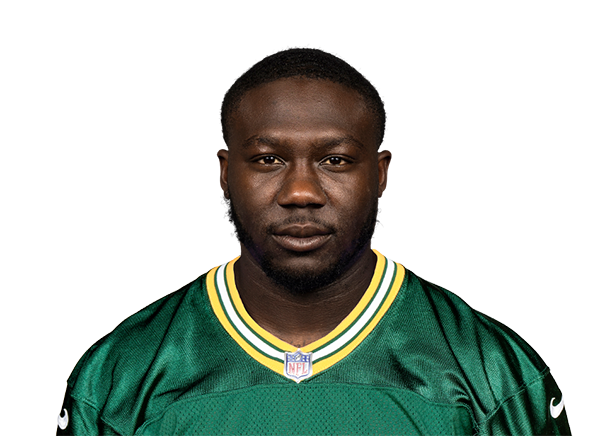 Robert Rochell |
38 | CB | Active | 6' 2" | 195 lbs | 6 | Central Arkansas |
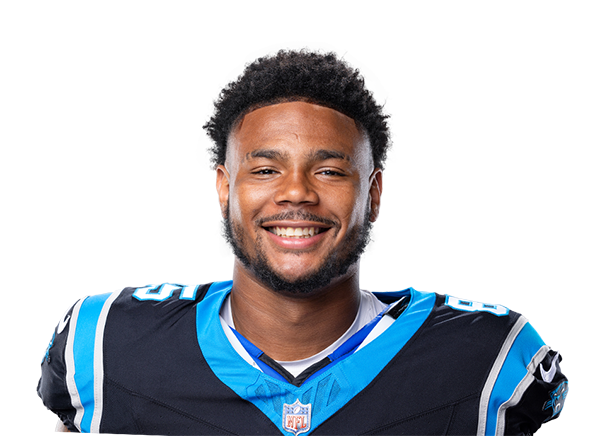 Ja'Tavion Sanders |
0 | TE | Active | 6' 4" | 252 lbs | 3 | Texas |
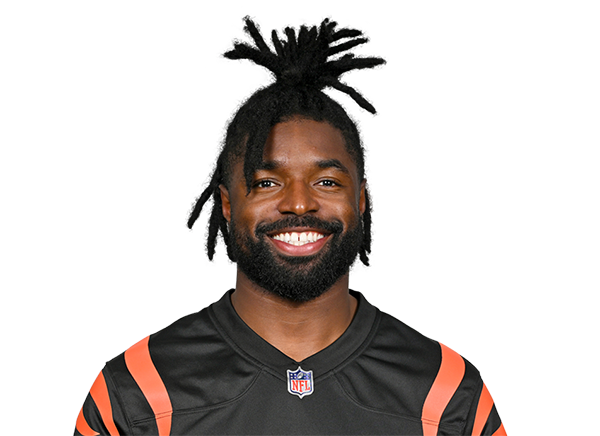 Nick Scott |
21 | S | Active | 5' 11" | 200 lbs | 8 | Penn State |
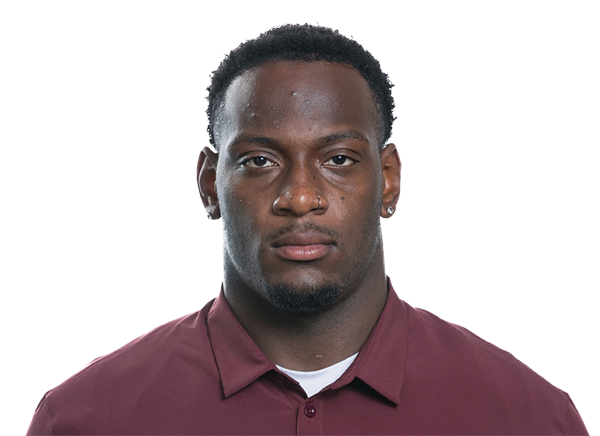 Nic Scourton |
11 | LB | Day-To-Day | 6' 2" | 257 lbs | 2 | Texas A&M |
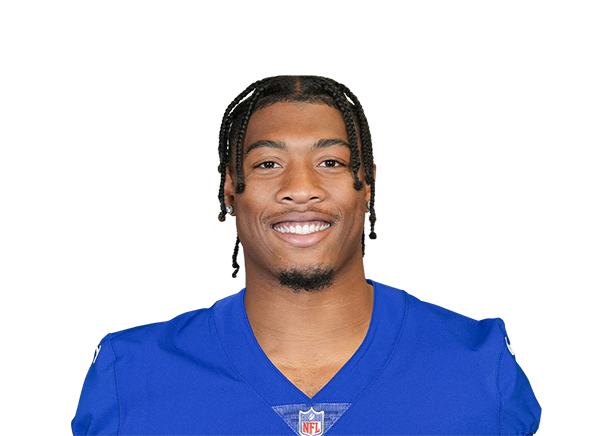 Isaiah Simmons |
27 | S | Active | 6' 4" | 232 lbs | 6 | Clemson |
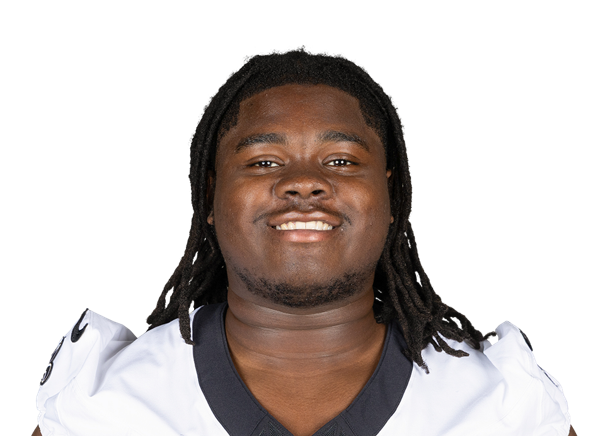 Torricelli Simpkins III |
65 | G | Active | 6' 5" | 312 lbs | 2 | South Carolina |
 DeVonta Smith |
43 | CB | Practice Squad | 5' 11" | 195 lbs | R | Notre Dame |
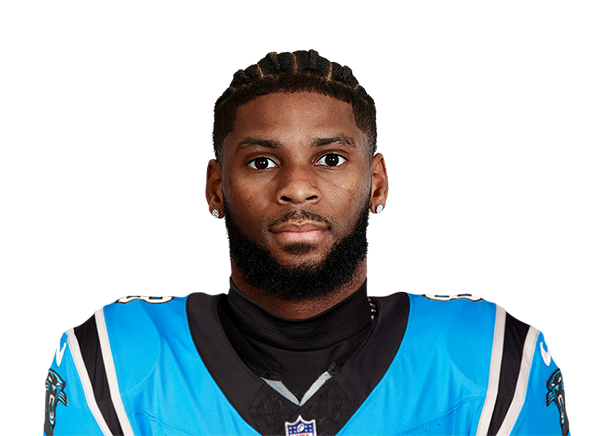 Ihmir Smith-Marsette |
- | WR | Practice Squad | 6' 1" | 200 lbs | 5 | Iowa |
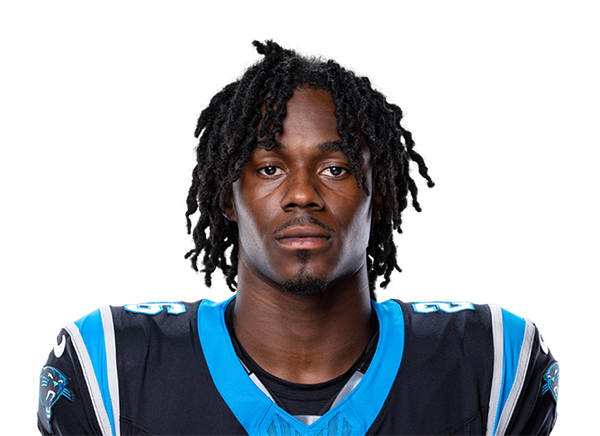 Chau Smith-Wade |
26 | CB | Active | 5' 11" | 176 lbs | 3 | Washington State |
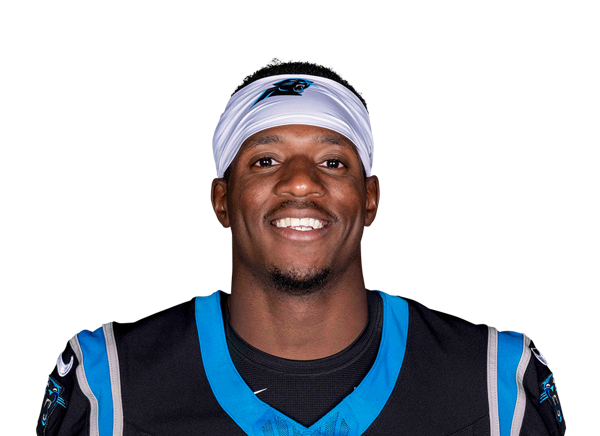 Corey Thornton |
31 | CB | Practice Squad | 6' 1" | 195 lbs | 2 | Louisville |
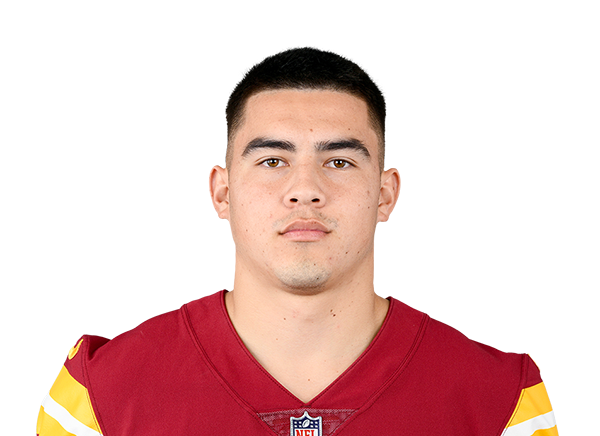 Brycen Tremayne |
87 | WR | Active | 6' 4" | 212 lbs | 2 | Stanford |
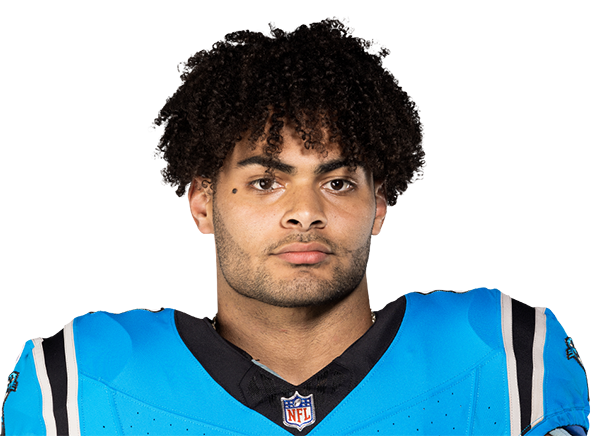 Tommy Tremble |
82 | TE | Active | 6' 4" | 250 lbs | 6 | Notre Dame |
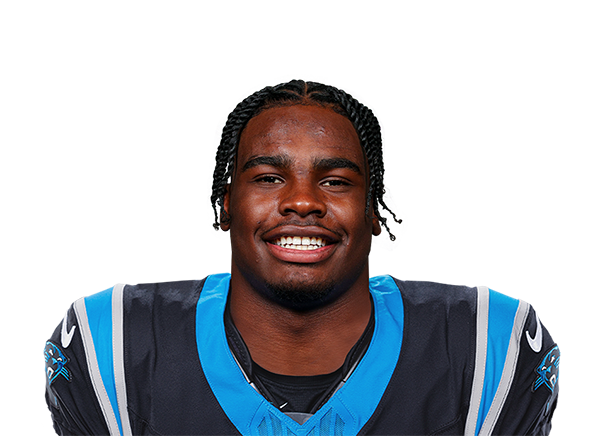 Anthony Tyus III |
34 | RB | Active | 6' 1" | 226 lbs | 1 | Ohio |
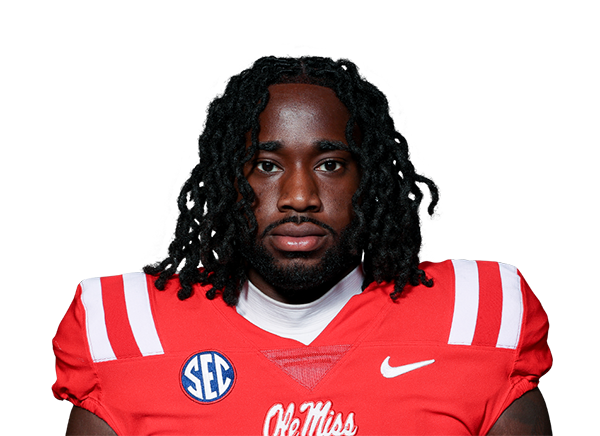 Princely Umanmielen |
3 | LB | Active | 6' 4" | 244 lbs | 2 | Ole Miss |
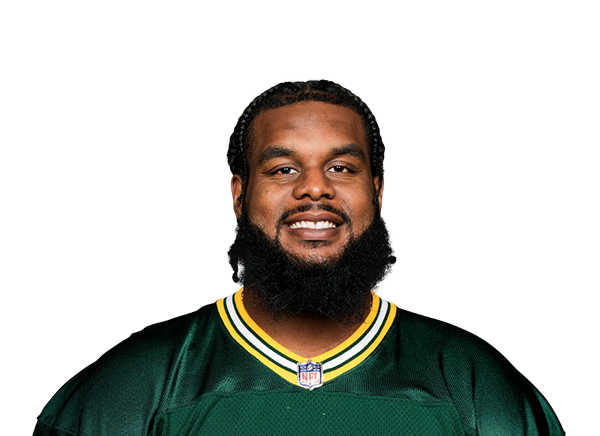 Rasheed Walker |
63 | OT | Active | 6' 6" | 325 lbs | 5 | Penn State |
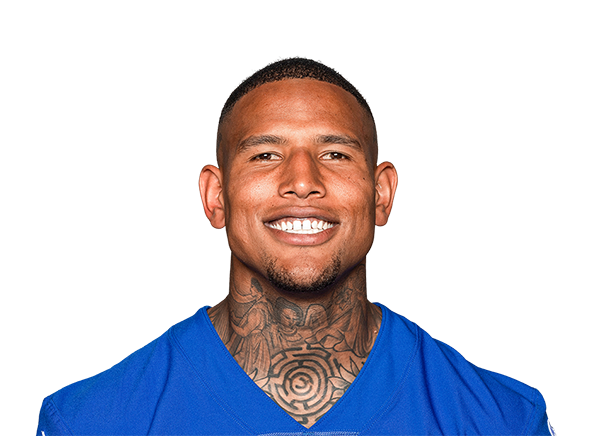 Darren Waller |
88 | TE | Active | 6' 6" | 245 lbs | 9 | Georgia Tech |
 Casey Washington |
88 | WR | Practice Squad | 6' 0" | 200 lbs | 3 | Illinois |
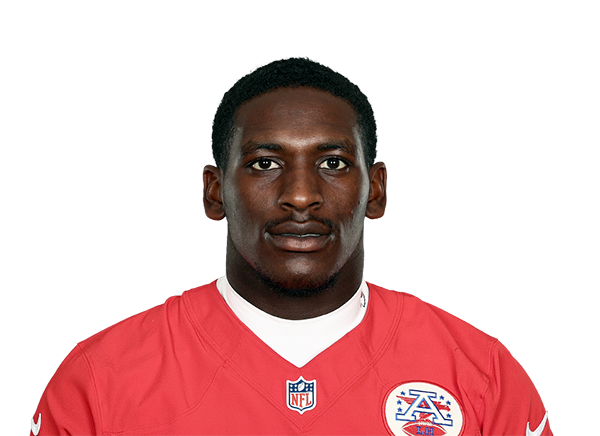 Tershawn Wharton |
98 | DT | Active | 6' 1" | 280 lbs | 7 | Missouri S&T |
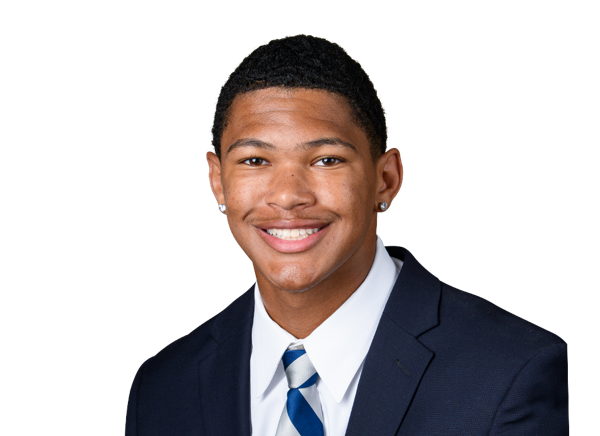 Zakee Wheatley |
38 | S | Active | 6' 3" | 203 lbs | R | Penn State |
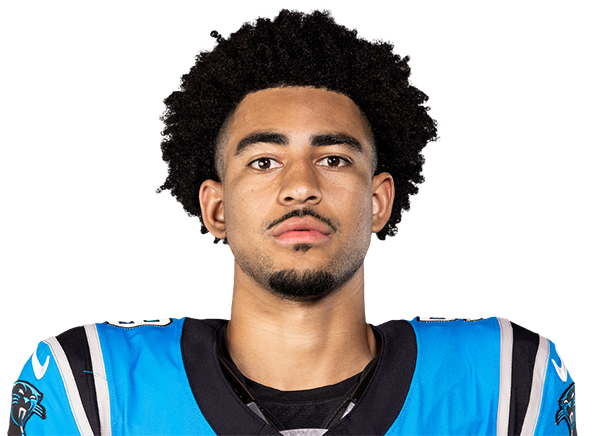 Bryce Young |
9 | QB | Active | 5' 10" | 204 lbs | 4 | Alabama |
Carolina Panthers — Stats
Team Scoring
| Wins | 3 |
| Losses | 2 |
| Ties | 0 |
| Win % | 0.6 |
| Points For | 146 |
| Points Against | 123 |
| Point Differential | 23 |
| Streak | 2 |
| Division Record | 0 |
Passing
| Completion Percentage | 59.9 |
| Completions | 121 |
| Interception Percentage | 1.00 |
| Interceptions | 2 |
| Longest Pass | 55 |
| Net Passing Yards | 1,478 |
| Net Passing Yards Per Game | 295.6 |
| Passing Attempts | 202 |
| Passing Touchdown % | 5.40 |
| Passing Touchdowns | 11 |
| Passer Rating | 98.0 |
| Total Sacks | 12 |
| Sack Yards Lost | 71 |
| Yards Per Pass Attempt | 7.7 |
| Passing Yards | 1,549 |
| Passing Fumbles Lost | 1 |
| Team Games Played | 5 |
| Yards Per Game | 418.6 |
| Total Points Per Game | 29.2 |
| Total Points | 146 |
| Total Touchdowns | 17 |
| Passing Yards Per Game | 309.8 |
| Comp-Att | 121-202 |
| Sacks-Yards Lost | 12-71 |
Rushing
| Rushing Attempts | 128 |
| Rushing Yards | 544 |
| Yards Per Rush Attempt | 4.3 |
| Long Rushing | 32 |
| 20+ Yard Rushing Plays | 3 |
| Rushing Touchdowns | 5 |
| Rushing Yards Per Game | 108.8 |
| Rushing Fumbles | 0 |
| Rushing Fumbles Lost | 0 |
| Rushing 1st downs | 33 |
| Team Games Played | 5 |
| Total Yards | 2,093 |
| Total Offensive Plays | 342 |
| Total Points Per Game | 29.2 |
| Total Points | 146 |
| Total Touchdowns | 17 |
Receiving
| Receptions | 121 |
| Receiving Targets | 182 |
| Receiving Yards | 1,549 |
| Receiving Yards | 1,549 |
| Receiving Touchdowns | 11 |
| Long Reception | 55 |
| 20+ Yard Receiving Plays | 21 |
| Receiving Yards Per Game | 309.8 |
| Receiving Fumbles | 4 |
| Receiving Fumbles Lost | 1 |
| Receiving Yards After Catch | 599 |
| Receiving First Downs | 74 |
| Team Games Played | 5 |
| Yards Per Reception | 12.8 |
| Total Points Per Game | 29.2 |
| Total Points | 146 |
| Total Touchdowns | 17 |
Miscellaneous
| Total 1st downs | 119 |
| Rushing 1st downs | 33 |
| Passing 1st downs | 74 |
| 1st downs by penalty | 12 |
| Third Down Conversions | 26 |
| Third Down Attempts | 67 |
| 3rd down % | 38.81 |
| Fourth Down Conversions | 4 |
| First Downs Attempts | 9 |
| 4th down % | 44.44 |
| Total Penalties | 48 |
| Total Penalty Yards | 419 |
| Possession Time Seconds | 9204 |
| Red Zone Field Goal Percentage | 23.81 |
| Red Zone Scoring Percentage | 90.48 |
| Red Zone Efficiency Percentage | 76.87 |
| Red Zone Touchdown Percentage | 66.67 |
| Total Takeaways | 7 |
| Total Giveaways | 4 |
| Turnover Ratio | 3 |
| Fumbles Lost | 2 |
| 3rd down efficiency | 26-67 |
| 4th down efficiency | 4-9 |
| Total-Yards | 48-419 |
Defense
| Solo Tackles | 195 |
| Assist Tackles | 136 |
| Total Tackles | 331 |
| Sacks | 11 |
| Sack Yards | 75 |
| Stuffs | 16 |
| Passes Defended | 25 |
| Average Interception Yards | 24.0 |
| Long Interception | 53 |
| Miscellaneous Touchdowns | 0 |
| Kicks Blocked | 0 |
| Tackles For Loss | 21 |
| Team Games Played | 5 |
Defensive Interceptions
| Interceptions | 3 |
| Interception Yards | 72 |
| Interception Touchdowns | 1 |
| INT: Total | 3-72 |
General
| Fumbles | 5 |
| Forced Fumbles | 4 |
| Fumbles Recovered | 4 |
| Fumbles Touchdowns | 0 |
| Games Played | 5 |
| Fumbles-Lost | 5-2 |
Returning
| Kick Returns | 23 |
| Kick Return Yards | 528 |
| Yards Per Kick Return | 23.0 |
| Long Kick Return | 30 |
| Kick Return Touchdowns | 0 |
| Punt Returns | 10 |
| Punt Return Yards | 137 |
| Yards Per Punt Return | 13.7 |
| Long Punt Return | 36 |
| Punt Return Touchdowns | 0 |
| Punt Return Fair Catches | 4 |
| Kick Return Fumbles Lost | 0 |
| Punt Return Fumbles Lost | 0 |
| Team Games Played | 5 |
| Punt: Total | 10-137 |
Kicking
| Field Goal Made | 11 |
| Field Goal Attempts | 11 |
| Field Goal Percentage | 100.0 |
| Long Field Goal Made | 53 |
| Field Goal Attempts 1-19 | 0 |
| Field Goal Attempts 20-29 | 1 |
| Field Goal Attempts 30-39 | 4 |
| Field Goal Attempts 40-49 | 4 |
| Field Goal Attempts 50+ | 2 |
| Extra Points Made | 11 |
| Extra Point Attempts | 15 |
| Extra Point Percentage | 73.3 |
| Field Goals Made 1-19 | 0 |
| Field Goals Made 20-29 | 1 |
| Field Goals Made 30-39 | 4 |
| Field Goals Made 40-49 | 4 |
| Field Goals Made 50+ | 2 |
| Total Kicking Points | 44 |
| Team Games Played | 5 |
| Touchback Percentage | 21 |
| Average Kickoff Return Yards | 20.6 |
| Kickoff Return Yards | 516 |
| Kickoff Returns | 25 |
| Kickoffs: Total | 25-516 |
| FG: Good-Attempts | 11-11 |
Punting
| Punts | 18 |
| Punt Yards | 838 |
| Long Punt | 61 |
| Gross Average Punt Yards | 46.6 |
| Net Average Punt Yards | 44.8 |
| Punts Blocked | 0 |
| Punts Inside 20 | 11 |
| Touchbacks | 2 |
| Fair Catches | 9 |
| Punt Returns | 3 |
| Punt Return Yards | 31 |
| Average Punt Return Yards | 10.3 |
| Team Games Played | 5 |
| Punt: Total Yards | 18-838 |
Scoring
| Rushing Touchdowns | 5 |
| Receiving Touchdowns | 11 |
| Return Touchdowns | 1 |
| Total Touchdowns | 16 |
| Field Goals | 11 |
| Kick Extra Points | 11 |
| Total Two Point Conversions | 0 |
| Total Points | 146 |
| Total Points Per Game | 29.2 |
Passing
| Completion Percentage | 60.3 |
| Completions | 114 |
| Interception Percentage | 1.59 |
| Interceptions | 3 |
| Longest Pass | 57 |
| Net Passing Yards | 1,110 |
| Net Passing Yards Per Game | 222.0 |
| Passing Attempts | 189 |
| Passing Touchdown % | 3.18 |
| Passing Touchdowns | 6 |
| Passer Rating | 82.4 |
| Total Sacks | 11 |
| Sack Yards Lost | 75 |
| Yards Per Pass Attempt | 6.3 |
| Passing Yards | 1,185 |
| Passing Fumbles Lost | 1 |
| Team Games Played | 5 |
| Yards Per Game | 369.2 |
| Total Points Per Game | 24.6 |
| Total Points | 123 |
| Total Touchdowns | 14 |
| Passing Yards Per Game | 237.0 |
| Comp-Att | 114-189 |
| Sacks-Yards Lost | 11-75 |
Rushing
| Rushing Attempts | 129 |
| Rushing Yards | 661 |
| Yards Per Rush Attempt | 5.1 |
| Long Rushing | 61 |
| 20+ Yard Rushing Plays | 5 |
| Rushing Touchdowns | 8 |
| Rushing Yards Per Game | 132.2 |
| Rushing Fumbles | 1 |
| Rushing Fumbles Lost | 1 |
| Rushing 1st downs | 32 |
| Team Games Played | 5 |
| Total Yards | 1,846 |
| Total Offensive Plays | 329 |
| Total Points Per Game | 24.6 |
| Total Points | 123 |
| Total Touchdowns | 14 |
Receiving
| Receptions | 114 |
| Receiving Targets | 182 |
| Receiving Yards | 1,185 |
| Receiving Yards | 1,185 |
| Receiving Touchdowns | 6 |
| Long Reception | 57 |
| 20+ Yard Receiving Plays | 9 |
| Receiving Yards Per Game | 237.0 |
| Receiving Fumbles | 1 |
| Receiving Fumbles Lost | 1 |
| Receiving Yards After Catch | 435 |
| Receiving First Downs | 59 |
| Team Games Played | 5 |
| Yards Per Reception | 10.4 |
| Total Points Per Game | 24.6 |
| Total Points | 123 |
| Total Touchdowns | 14 |
Miscellaneous
| Total 1st downs | 101 |
| Rushing 1st downs | 32 |
| Passing 1st downs | 59 |
| 1st downs by penalty | 10 |
| Third Down Conversions | 29 |
| Third Down Attempts | 69 |
| 3rd down % | 42.03 |
| Fourth Down Conversions | 4 |
| First Downs Attempts | 10 |
| 4th down % | 40.00 |
| Total Penalties | 50 |
| Total Penalty Yards | 331 |
| Possession Time Seconds | 8796 |
| Red Zone Field Goal Percentage | 7.69 |
| Red Zone Scoring Percentage | 84.62 |
| Red Zone Efficiency Percentage | 80.22 |
| Red Zone Touchdown Percentage | 76.92 |
| Total Takeaways | 4 |
| Total Giveaways | 7 |
| Turnover Ratio | -3 |
| Fumbles Lost | 4 |
| 3rd down efficiency | 29-69 |
| 4th down efficiency | 4-10 |
| Total-Yards | 50-331 |
Defense
| Solo Tackles | 181 |
| Assist Tackles | 175 |
| Total Tackles | 356 |
| Sacks | 12 |
| Sack Yards | 71 |
| Stuffs | 19 |
| Passes Defended | 20 |
| Average Interception Yards | -1.0 |
| Long Interception | 0 |
| Miscellaneous Touchdowns | 0 |
| Kicks Blocked | 1 |
| Tackles For Loss | 22 |
| Team Games Played | 5 |
Defensive Interceptions
| Interceptions | 2 |
| Interception Yards | -2 |
| Interception Touchdowns | 0 |
| INT: Total | 2--2 |
General
| Fumbles | 5 |
| Forced Fumbles | 4 |
| Fumbles Recovered | 2 |
| Fumbles Touchdowns | 0 |
| Games Played | 5 |
| Fumbles-Lost | 5-4 |
Returning
| Kick Returns | 25 |
| Kick Return Yards | 516 |
| Yards Per Kick Return | 20.6 |
| Long Kick Return | 28 |
| Kick Return Touchdowns | 0 |
| Punt Returns | 3 |
| Punt Return Yards | 31 |
| Yards Per Punt Return | 10.3 |
| Long Punt Return | 23 |
| Punt Return Touchdowns | 0 |
| Punt Return Fair Catches | 9 |
| Kick Return Fumbles Lost | 0 |
| Punt Return Fumbles Lost | 0 |
| Team Games Played | 5 |
| Punt: Total | 3-31 |
Kicking
| Field Goal Made | 8 |
| Field Goal Attempts | 9 |
| Field Goal Percentage | 88.9 |
| Long Field Goal Made | 54 |
| Field Goal Attempts 1-19 | 0 |
| Field Goal Attempts 20-29 | 1 |
| Field Goal Attempts 30-39 | 0 |
| Field Goal Attempts 40-49 | 6 |
| Field Goal Attempts 50+ | 2 |
| Extra Points Made | 13 |
| Extra Point Attempts | 13 |
| Extra Point Percentage | 100.0 |
| Field Goals Made 1-19 | 0 |
| Field Goals Made 20-29 | 1 |
| Field Goals Made 30-39 | 0 |
| Field Goals Made 40-49 | 6 |
| Field Goals Made 50+ | 1 |
| Total Kicking Points | 37 |
| Team Games Played | 5 |
| Touchback Percentage | 4 |
| Average Kickoff Return Yards | 23.0 |
| Kickoff Return Yards | 528 |
| Kickoff Returns | 23 |
| Kickoffs: Total | 23-528 |
| FG: Good-Attempts | 8-9 |
Punting
| Punts | 20 |
| Punt Yards | 917 |
| Long Punt | 65 |
| Gross Average Punt Yards | 45.9 |
| Net Average Punt Yards | 39.0 |
| Punts Blocked | 0 |
| Punts Inside 20 | 7 |
| Touchbacks | 0 |
| Fair Catches | 4 |
| Punt Returns | 10 |
| Punt Return Yards | 137 |
| Average Punt Return Yards | 13.7 |
| Team Games Played | 5 |
| Punt: Total Yards | 20-917 |
Scoring
| Rushing Touchdowns | 8 |
| Receiving Touchdowns | 6 |
| Return Touchdowns | 0 |
| Total Touchdowns | 14 |
| Field Goals | 8 |
| Kick Extra Points | 13 |
| Total Two Point Conversions | 1 |
| Total Points | 123 |
| Total Points Per Game | 24.6 |


