
Recent Results
| Date | Matchup | Result / Time |
|---|---|---|
| Oct 15, 2026 | Denver Broncos vs Seattle Seahawks | Thu, Oct 15 8:15 PM ET |
| Oct 11, 2026 | Denver Broncos @ Los Angeles Chargers | Sun, Oct 11 4:05 PM ET |
| Oct 4, 2026 | Denver Broncos @ San Francisco 49ers | Sun, Oct 4 4:25 PM ET |
Upcoming Games
| Date | Matchup | Result / Time |
|---|---|---|
| Oct 25, 2026 | Denver Broncos @ Arizona Cardinals | Sun, Oct 25 4:05 PM ET |
| Nov 1, 2026 | Denver Broncos vs Kansas City Chiefs | Sun, Nov 1 4:25 PM ET |
| Nov 8, 2026 | Denver Broncos @ Carolina Panthers | Sun, Nov 8 1:00 PM ET |

Denver Broncos
4-2
🏟 Empower Field at Mile High
Division Standings
| Team | W | L | T | PCT | DIV | PF | PA | STRK |
|---|---|---|---|---|---|---|---|---|
| Kansas City Chiefs | 5 | 0 | 0 | 1.000 | - | 140 | 83 | W5 |
| Buffalo Bills | 5 | 1 | 0 | .833 | - | 197 | 171 | W2 |
| Jacksonville Jaguars | 4 | 2 | 0 | .667 | - | 154 | 104 | L1 |
| Cleveland Browns | 4 | 2 | 0 | .667 | - | 106 | 122 | W1 |
| Denver Broncos | 4 | 2 | 0 | .667 | - | 114 | 125 | W2 |
| Pittsburgh Steelers | 4 | 2 | 0 | .667 | - | 137 | 128 | W2 |
| Baltimore Ravens | 4 | 2 | 0 | .667 | - | 156 | 132 | L1 |
| Cincinnati Bengals | 3 | 2 | 0 | .600 | - | 128 | 109 | W1 |
| New England Patriots | 4 | 3 | 0 | .571 | - | 160 | 143 | L1 |
| Las Vegas Raiders | 3 | 3 | 0 | .500 | - | 162 | 162 | L3 |
| New York Jets | 2 | 4 | 0 | .333 | - | 112 | 122 | L1 |
| Indianapolis Colts | 2 | 4 | 0 | .333 | - | 144 | 164 | L2 |
| Houston Texans | 2 | 4 | 0 | .333 | - | 144 | 143 | W2 |
| Tennessee Titans | 1 | 5 | 0 | .167 | - | 84 | 129 | W1 |
| Miami Dolphins | 0 | 5 | 0 | .000 | - | 70 | 132 | L5 |
| Los Angeles Chargers | 0 | 6 | 0 | .000 | - | 90 | 151 | L6 |
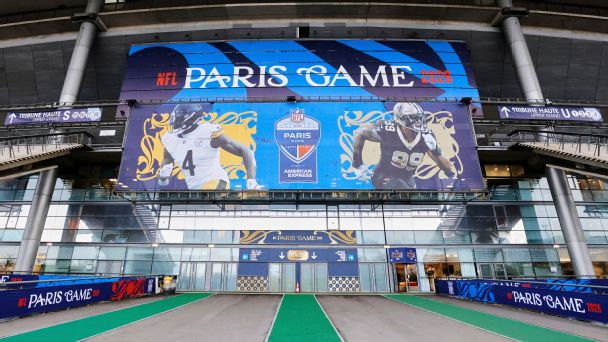
Week 7 NFL highlights: Best plays, moments, touchdowns, more
Check here for Sunday's top moments, starting with Aaron Rodgers, Jaylen Warren, Tyler Shough and Alvin Kamara in France.
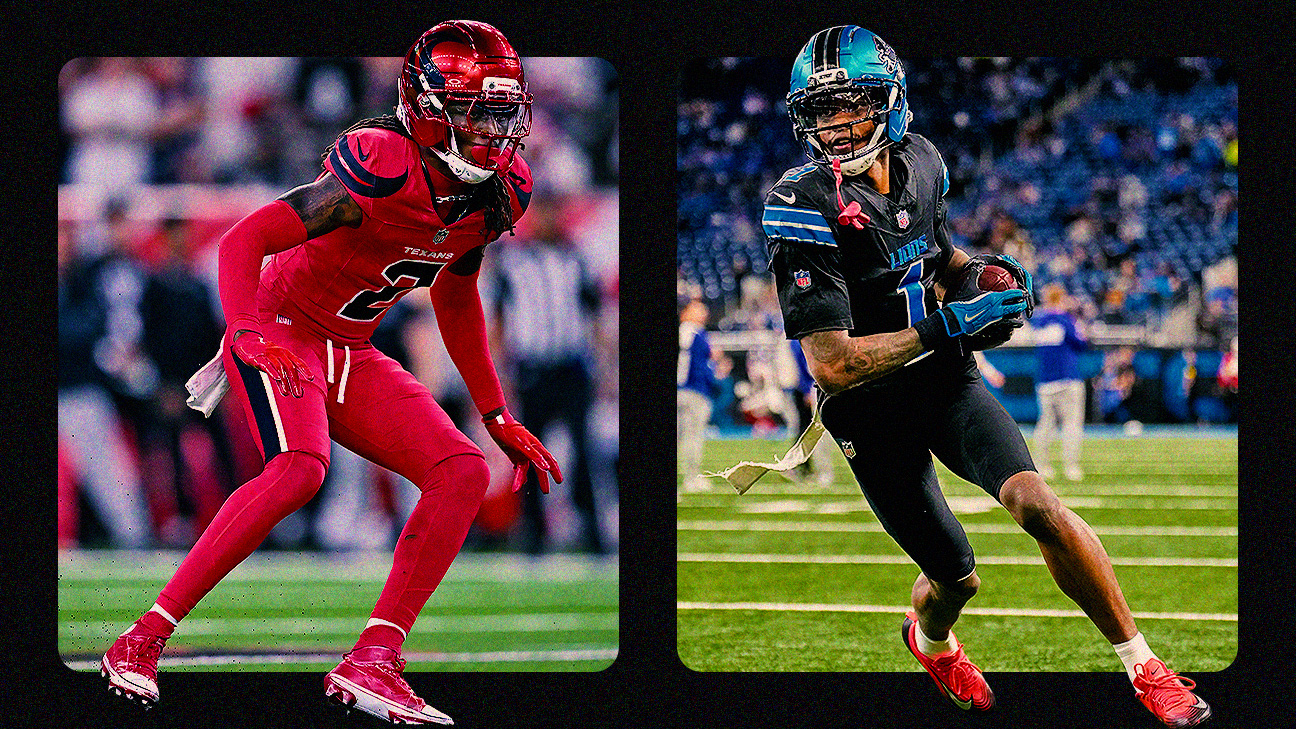
NFL Week 7 uniforms: Alternates galore as Texans go battle red, Lions all-black
Here's a look at what each NFL team is wearing in Week 7, led by alternate looks from Houston, Detroit and Dallas.
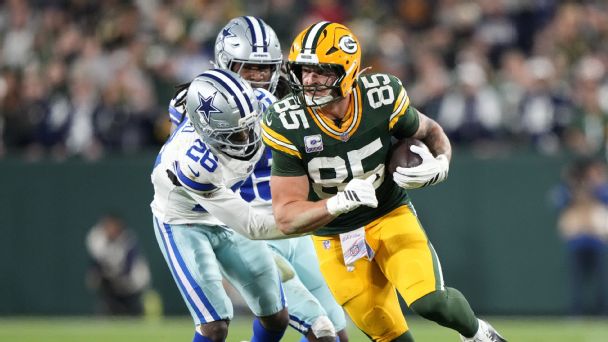
NFL Week 7 predictions: Upsets, fantasy sleepers, stat lines, TD scorers, more
Touchdowns for Tucker Kraft and Germie Bernard? Cardinals pull another upset? Revenge game for Trey Hendrickson? Let's predict 15 things for Week 7.
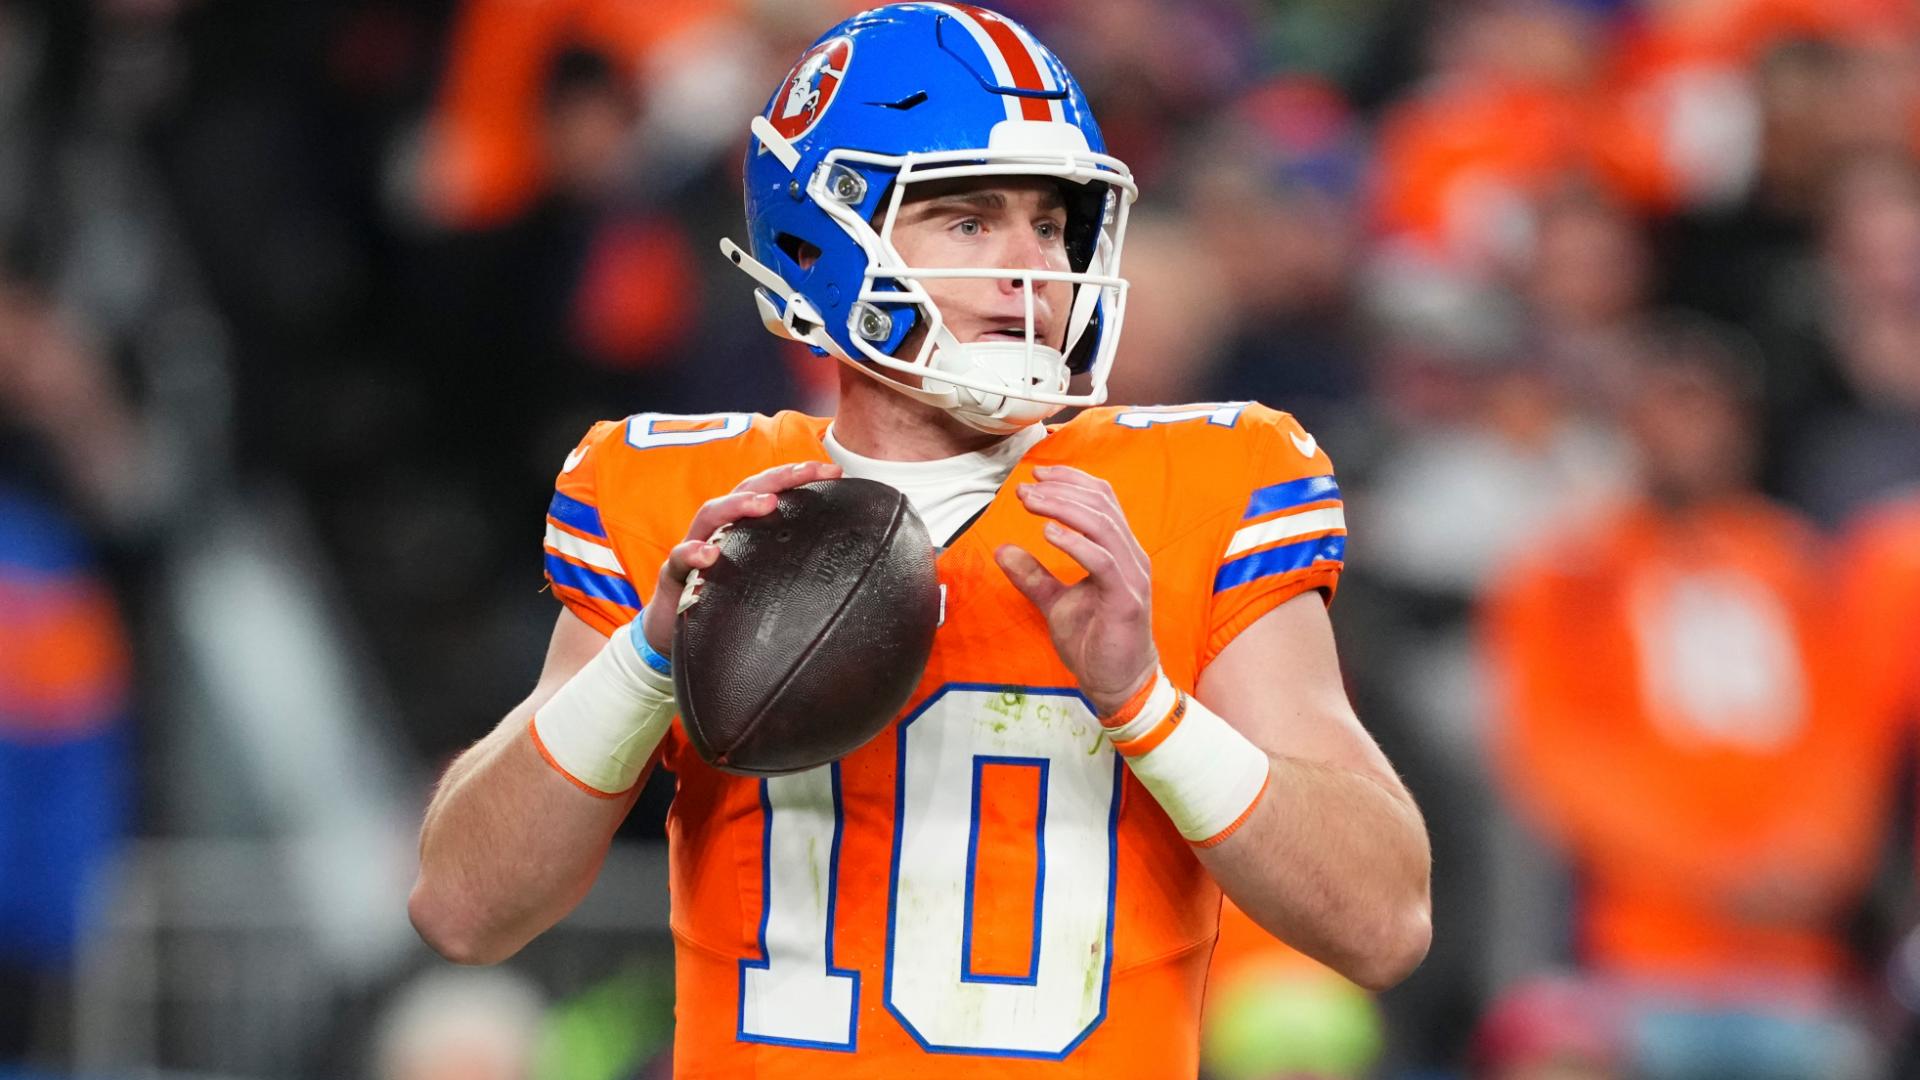
Broncos' offense running out of excuses
Jeff Legwold explains why the Broncos' offense needs to step up against one of the NFL's worst defenses.
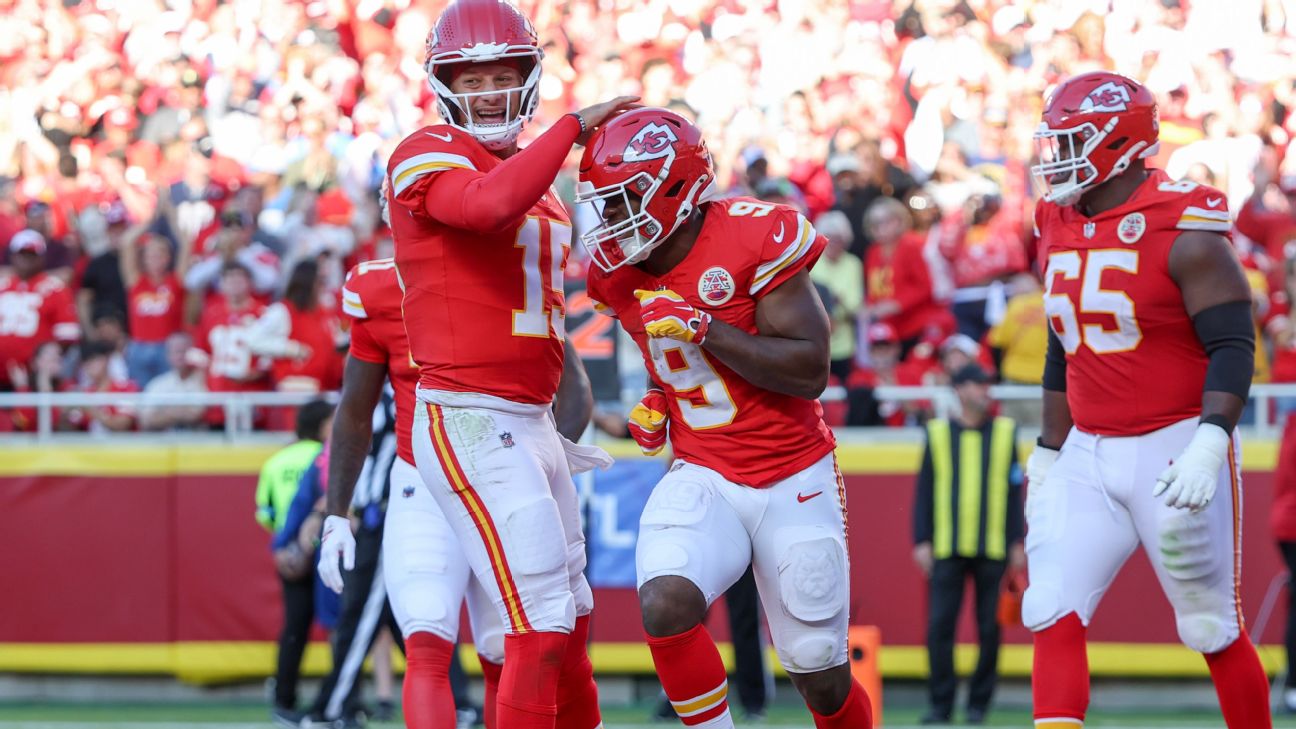
NFL Week 7 betting odds: Lines and totals for every game
A look at the odds, spreads, totals and FPI predictions for every NFL game in Week 7.
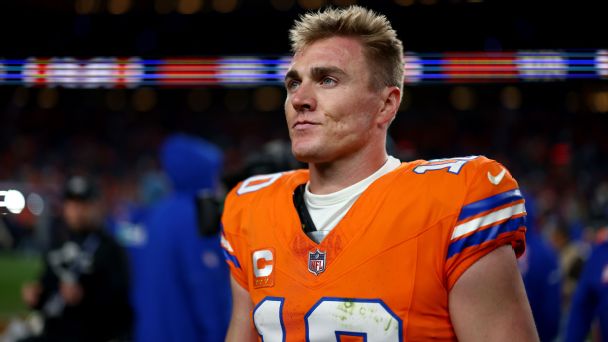
What's wrong with Bo Nix? Exploring the Broncos QB's struggles, long-term status
The Broncos are winning, but Nix is dealing with the roughest stretch of his career. Why is he struggling -- and is he still Denver's long-term QB?
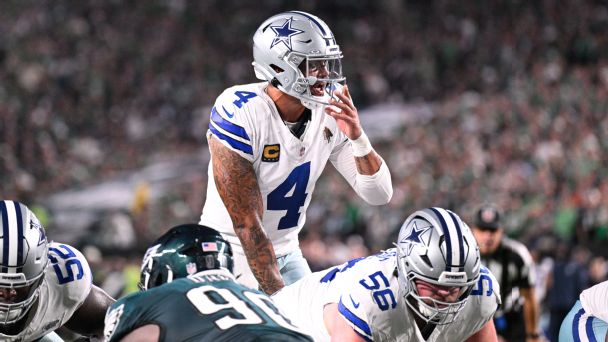
NFL Week 7 preview: Picks, predictions, schedule, betting odds, fantasy tips
Cowboys at Eagles? Bengals at Ravens? The Steelers and Saints in Paris? There are 13 more games in Week 7, and we have picks, predictions and more for all of them.
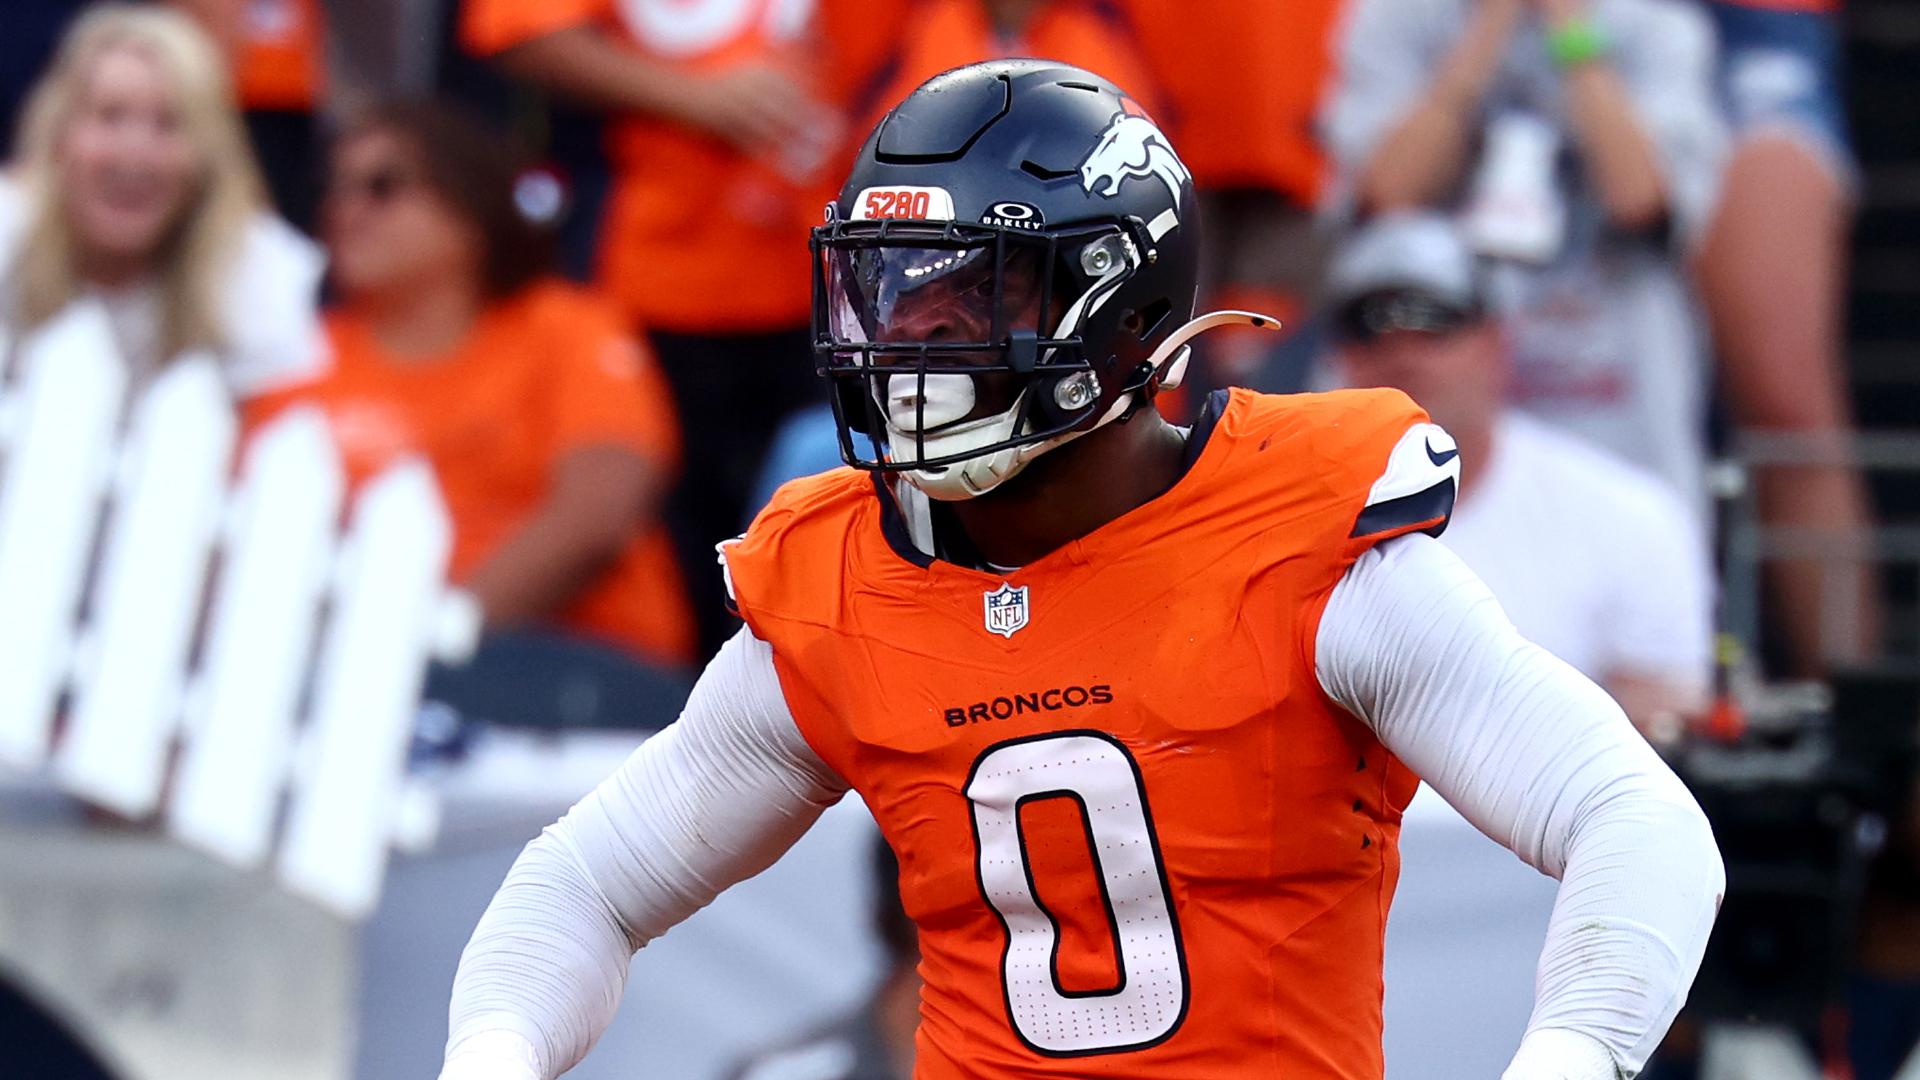
Jonathon Cooper's return could boost Nik Bonitto
Jeff Legwold explains how Jonathon Cooper's return could create more opportunities for Nik Bonitto to get after the quarterback.
| Date | Matchup | Result / Time |
|---|---|---|
| Sep 14, 2026 | Denver Broncos @ Kansas City Chiefs | Mon, Sep 14 8:15 PM ET |
| Sep 20, 2026 | Denver Broncos vs Jacksonville Jaguars | Sun, Sep 20 4:05 PM ET |
| Sep 27, 2026 | Denver Broncos vs Los Angeles Rams | Sun, Sep 27 8:20 PM ET |
| Oct 4, 2026 | Denver Broncos @ San Francisco 49ers | Sun, Oct 4 4:25 PM ET |
| Oct 11, 2026 | Denver Broncos @ Los Angeles Chargers | Sun, Oct 11 4:05 PM ET |
| Oct 15, 2026 | Denver Broncos vs Seattle Seahawks | Thu, Oct 15 8:15 PM ET |
| Oct 25, 2026 | Denver Broncos @ Arizona Cardinals | Sun, Oct 25 4:05 PM ET |
| Nov 1, 2026 | Denver Broncos vs Kansas City Chiefs | Sun, Nov 1 4:25 PM ET |
| Nov 8, 2026 | Denver Broncos @ Carolina Panthers | Sun, Nov 8 1:00 PM ET |
| Nov 22, 2026 | Denver Broncos vs Las Vegas Raiders | Sun, Nov 22 4:25 PM ET |
| Nov 27, 2026 | Denver Broncos @ Pittsburgh Steelers | Fri, Nov 27 3:00 PM ET |
| Dec 6, 2026 | Denver Broncos vs Miami Dolphins | Sun, Dec 6 4:05 PM ET |
| Dec 13, 2026 | Denver Broncos @ New York Jets | Sun, Dec 13 1:00 PM ET |
| Dec 20, 2026 | Denver Broncos @ Las Vegas Raiders | Sun, Dec 20 4:25 PM ET |
| Dec 25, 2026 | Denver Broncos vs Buffalo Bills | Fri, Dec 25 4:30 PM ET |
| Jan 3, 2027 | Denver Broncos @ New England Patriots | Sun, Jan 3 12:00 AM ET |
| Jan 10, 2027 | Denver Broncos vs Los Angeles Chargers | Sun, Jan 10 12:00 AM ET |
Roster
| Player | No | Pos | Status | Height | Weight | Experience | College |
|---|---|---|---|---|---|---|---|
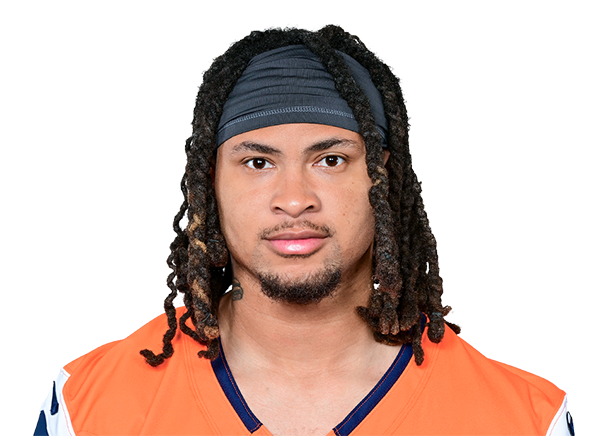 Kris Abrams-Draine |
31 | CB | Active | 5' 11" | 178 lbs | 3 | Missouri |
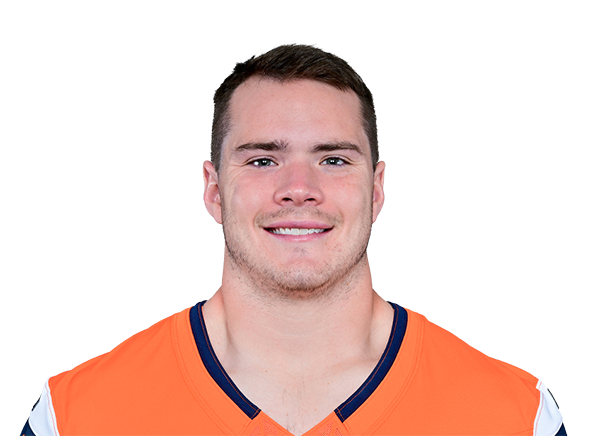 Nate Adkins |
45 | TE | Active | 6' 3" | 252 lbs | 4 | South Carolina |
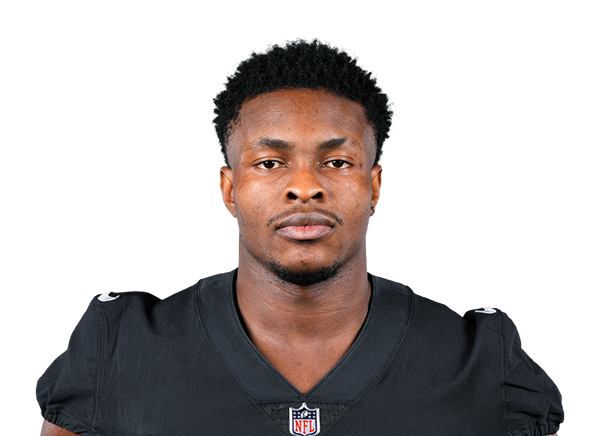 David Ebuka Agoha |
- | DE | Practice Squad | 6' 4" | 252 lbs | 1 | - |
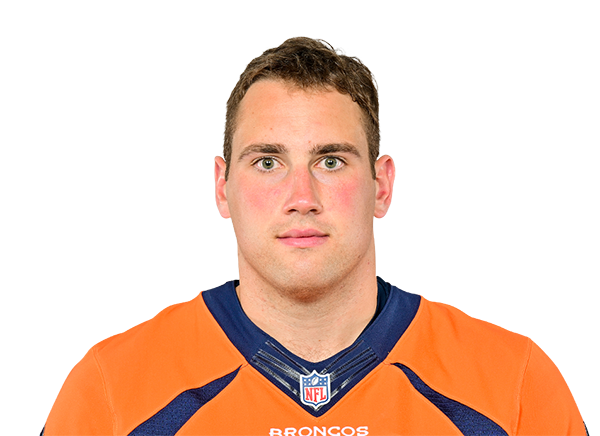 Zach Allen |
99 | DE | Active | 6' 5" | 285 lbs | 8 | Boston College |
 Ugo Amadi |
- | S | Practice Squad | 5' 9" | 201 lbs | 8 | Oregon |
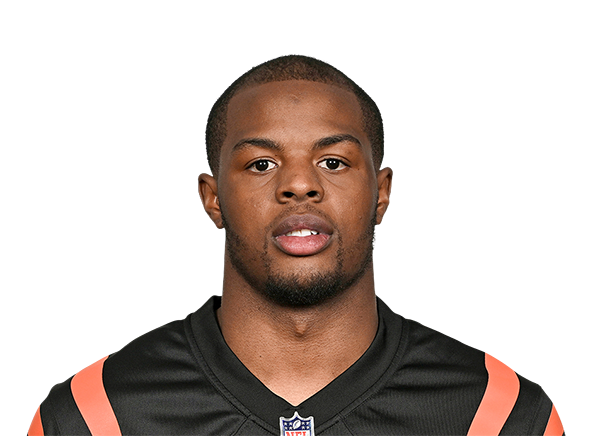 Tycen Anderson |
6 | S | Active | 6' 2" | 210 lbs | 5 | Toledo |
 Brent Austin |
33 | CB | Active | 5' 11" | 180 lbs | R | California |
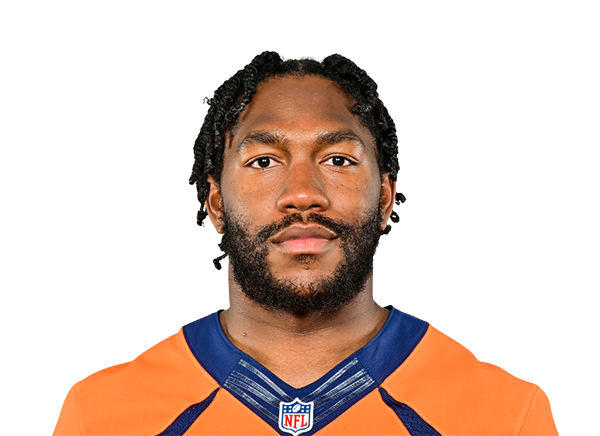 Tyler Badie |
28 | RB | Day-To-Day | 5' 8" | 197 lbs | 3 | Missouri |
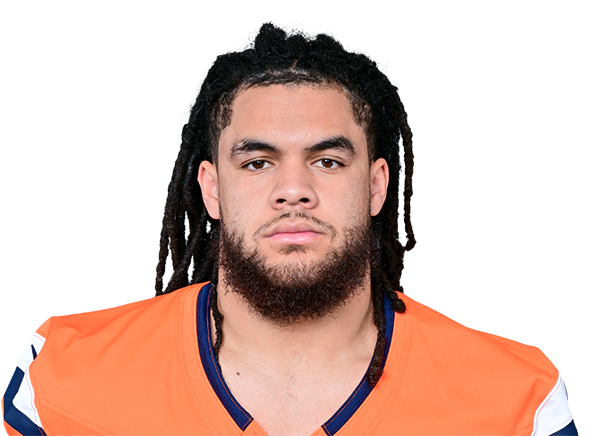 Levelle Bailey |
56 | LB | Day-To-Day | 6' 2" | 225 lbs | 2 | Fresno State |
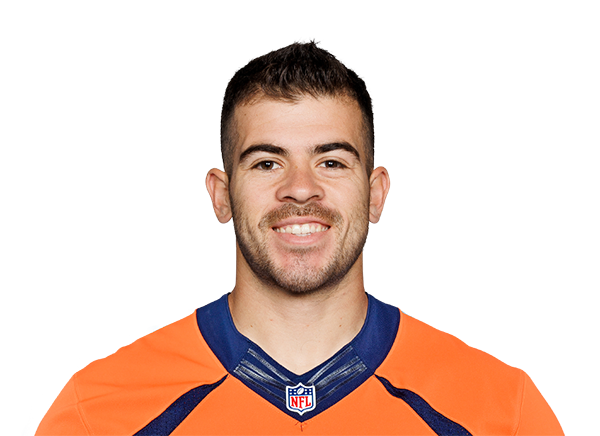 Michael Bandy |
83 | WR | Practice Squad | 5' 10" | 190 lbs | 3 | San Diego |
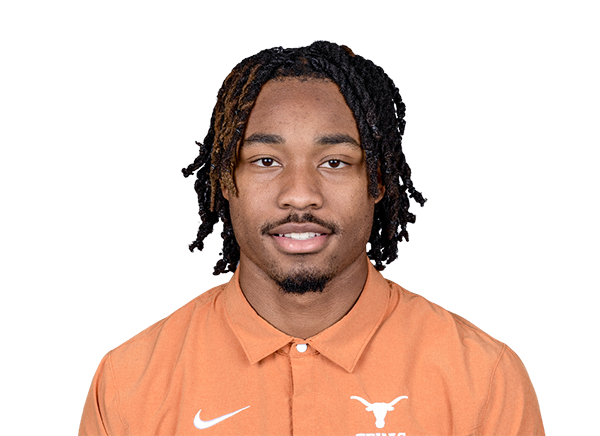 Jahdae Barron |
23 | CB | Active | 5' 11" | 200 lbs | 2 | Texas |
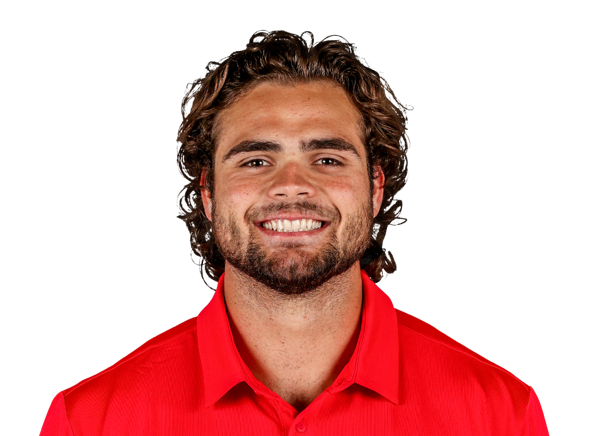 Dallen Bentley |
89 | TE | Active | 6' 4" | 253 lbs | R | Utah |
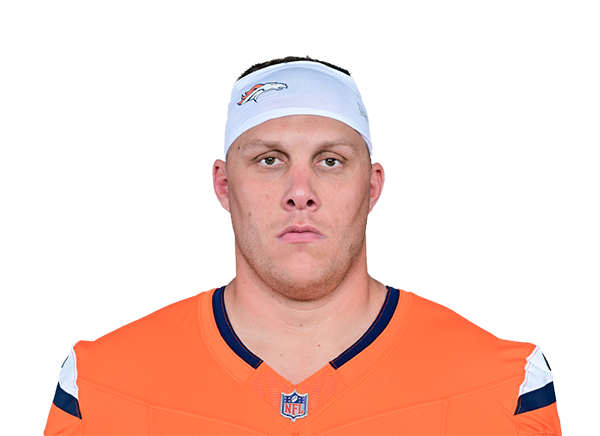 Garett Bolles |
72 | OT | Active | 6' 5" | 300 lbs | 10 | Utah |
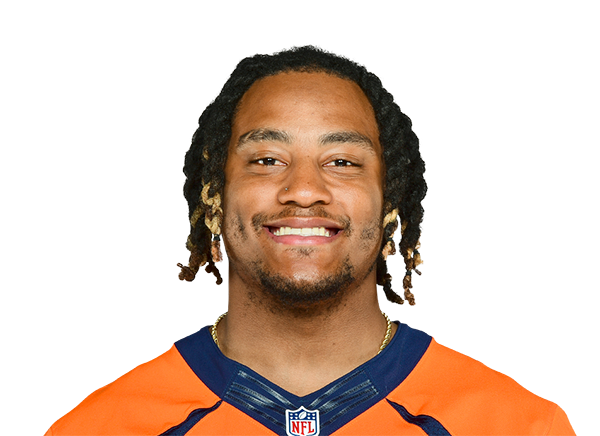 Nik Bonitto |
15 | LB | Active | 6' 3" | 240 lbs | 5 | Oklahoma |
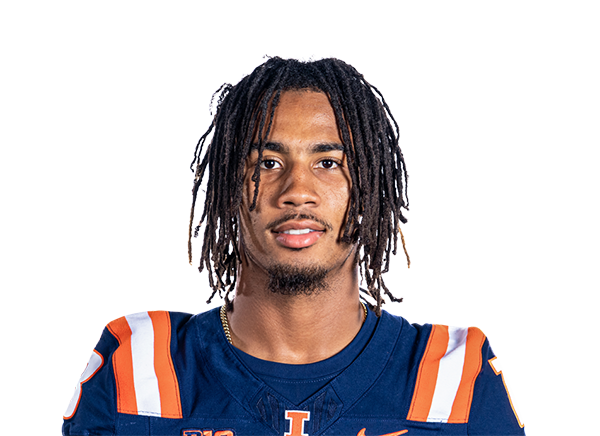 Pat Bryant |
13 | WR | Day-To-Day | 6' 2" | 204 lbs | 2 | Illinois |
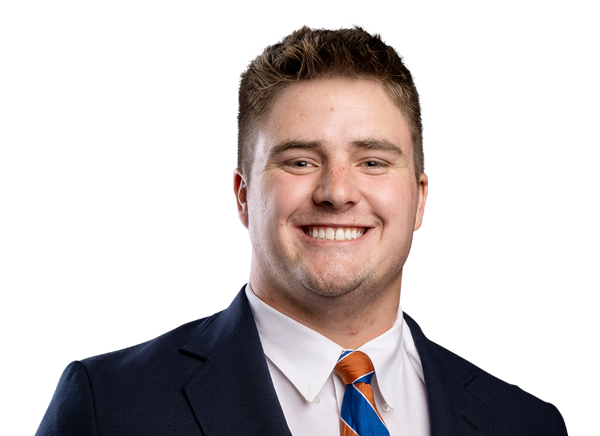 Kage Casey |
78 | OT | Active | 6' 5" | 310 lbs | R | Boise State |
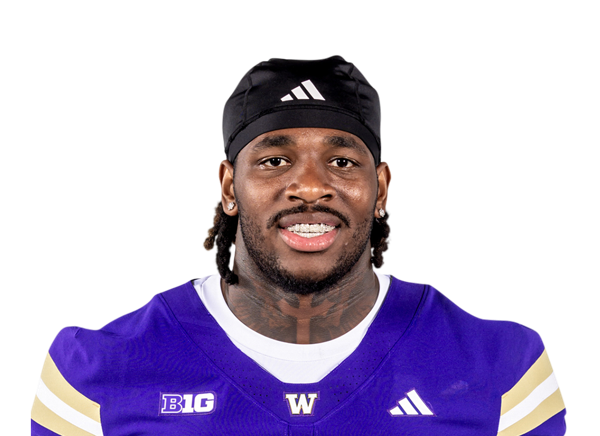 Jonah Coleman |
20 | RB | Active | 5' 8" | 220 lbs | R | Washington |
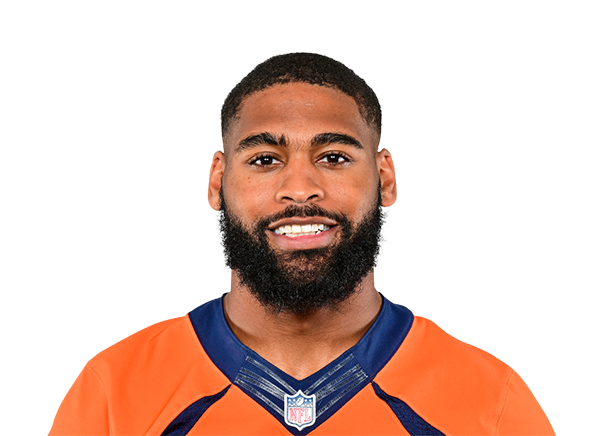 Jonathon Cooper |
0 | LB | Active | 6' 4" | 257 lbs | 6 | Ohio State |
 Jeremy Crawshaw |
16 | P | Active | 6' 3" | 205 lbs | 2 | Florida |
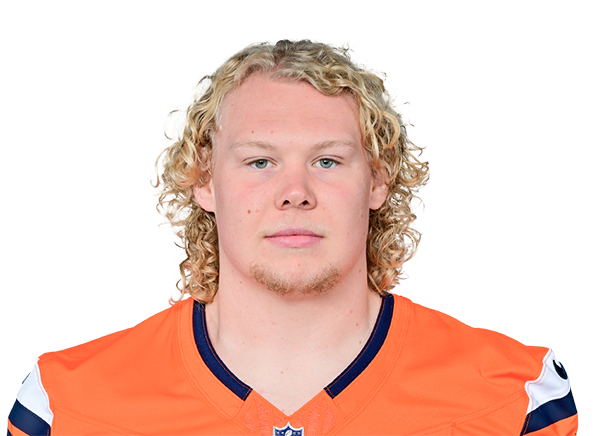 Frank Crum |
73 | OT | Day-To-Day | 6' 7" | 315 lbs | 3 | Wyoming |
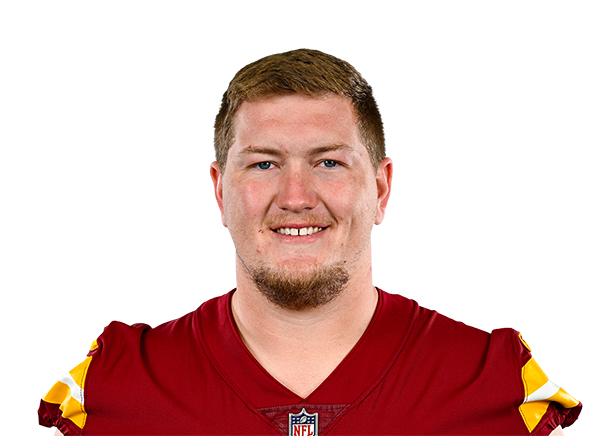 Michael Deiter |
67 | C | Day-To-Day | 6' 6" | 310 lbs | 7 | Wisconsin |
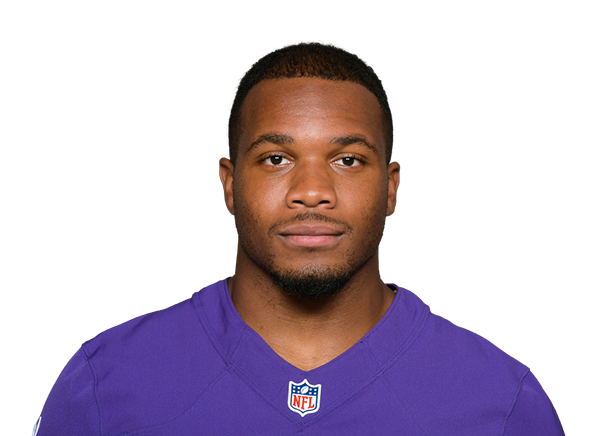 J.K. Dobbins |
27 | RB | Active | 5' 10" | 212 lbs | 7 | Ohio State |
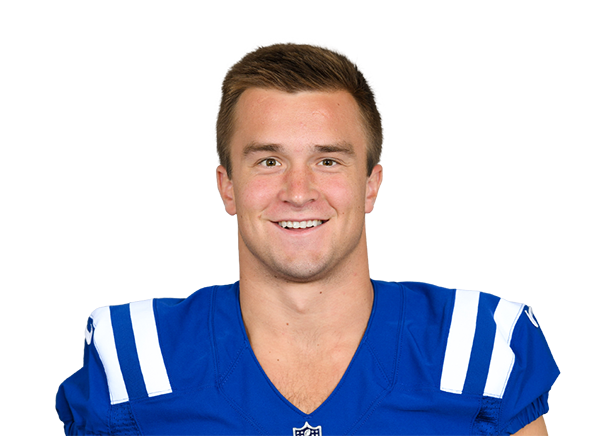 Sam Ehlinger |
4 | QB | Active | 6' 1" | 222 lbs | 6 | Texas |
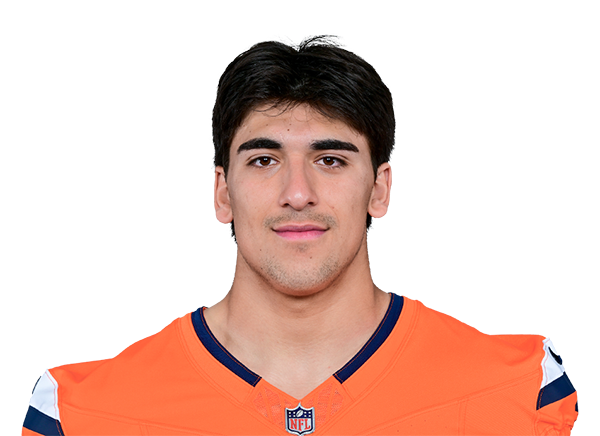 Jonah Elliss |
52 | LB | Day-To-Day | 6' 2" | 246 lbs | 3 | Utah |
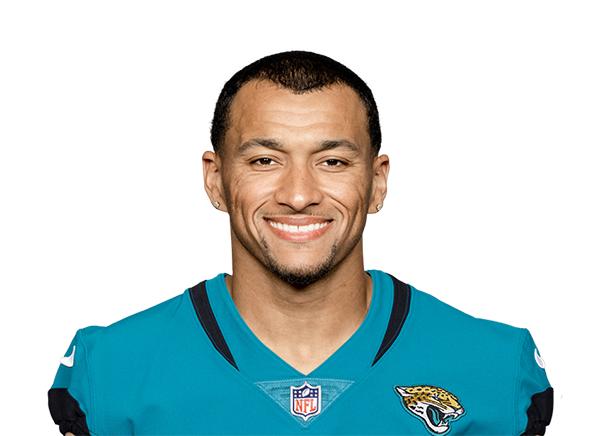 Evan Engram |
1 | TE | Active | 6' 3" | 240 lbs | 10 | Ole Miss |
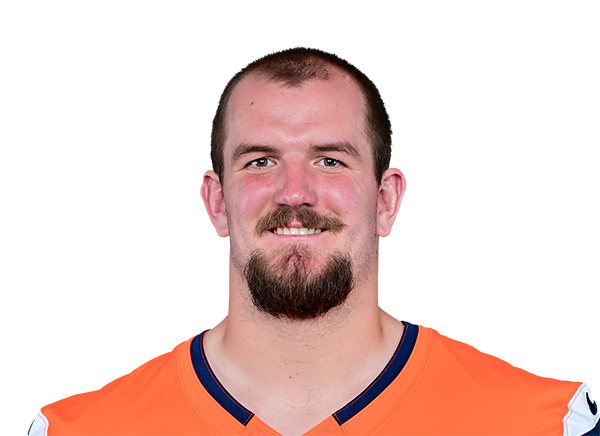 Alex Forsyth |
54 | C | Active | 6' 4" | 312 lbs | 4 | Oregon |
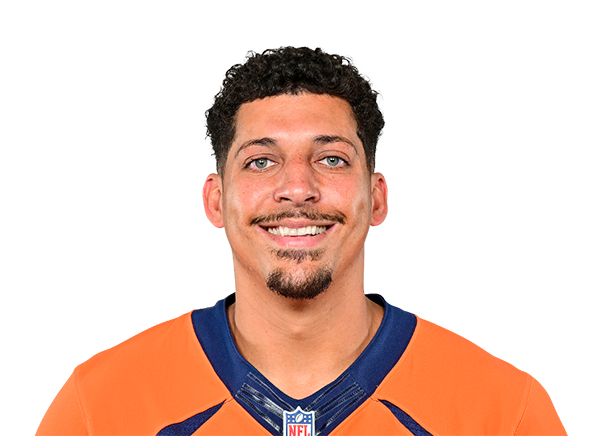 Mitchell Fraboni |
48 | LS | Active | 6' 2" | 223 lbs | 5 | Arizona State |
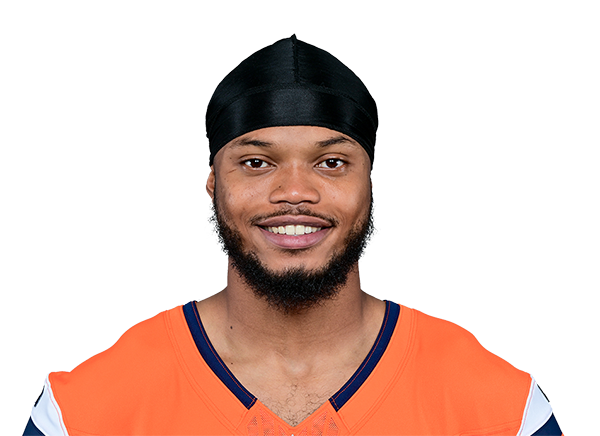 Troy Franklin |
11 | WR | Active | 6' 3" | 180 lbs | 3 | Oregon |
 Sean Fresch |
37 | CB | Active | 5' 9" | 181 lbs | 1 | Rice |
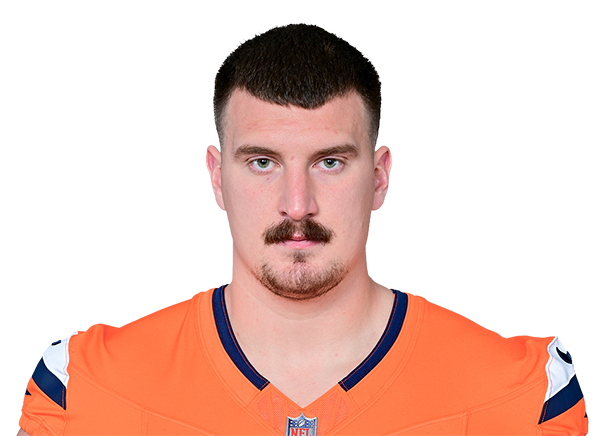 Nick Gargiulo |
66 | G | Day-To-Day | 6' 5" | 310 lbs | 2 | South Carolina |
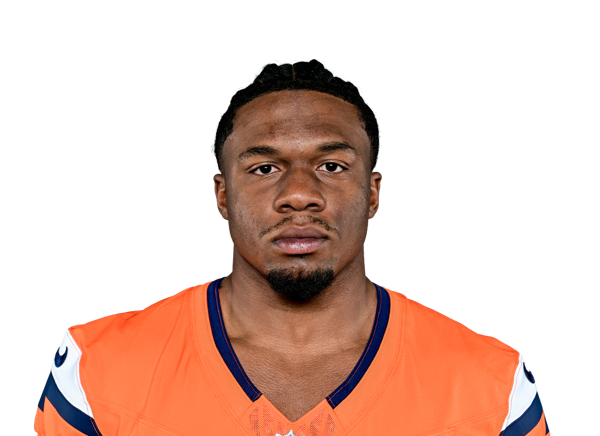 RJ Harvey |
12 | RB | Active | 5' 8" | 205 lbs | 2 | UCF |
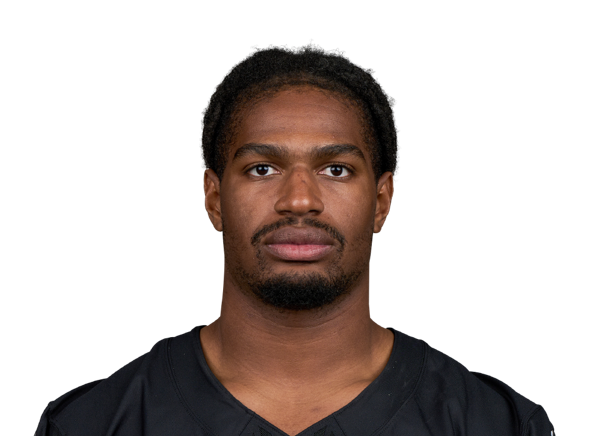 Jahfari Harvey |
- | DE | Practice Squad | 6' 2" | 255 lbs | 1 | SMU |
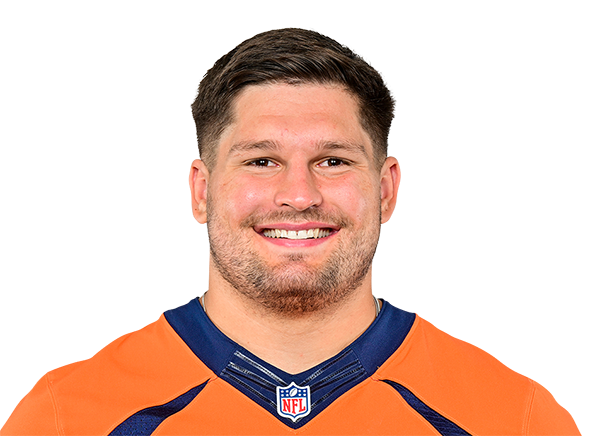 Matt Henningsen |
91 | DE | Day-To-Day | 6' 3" | 291 lbs | 4 | Wisconsin |
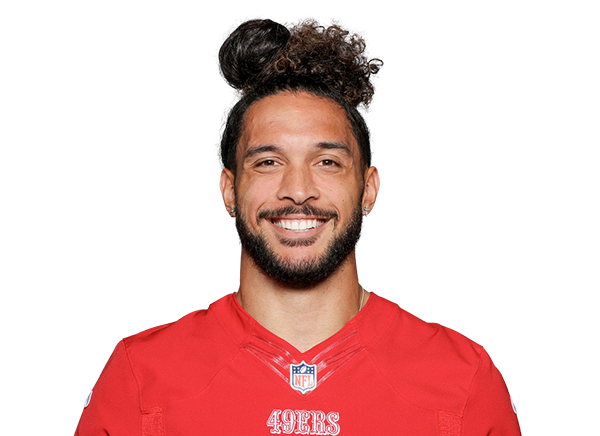 Talanoa Hufanga |
9 | S | Active | 6' 0" | 200 lbs | 6 | USC |
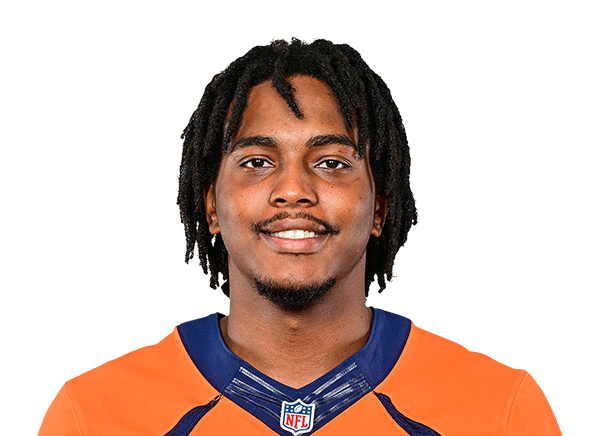 Lil'Jordan Humphrey |
5 | WR | Active | 6' 4" | 225 lbs | 7 | Texas |
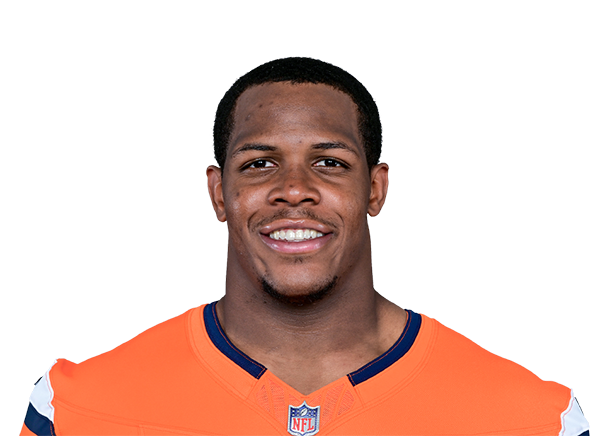 Jordan Jackson |
94 | DT | Active | 6' 4" | 294 lbs | 3 | Air Force |
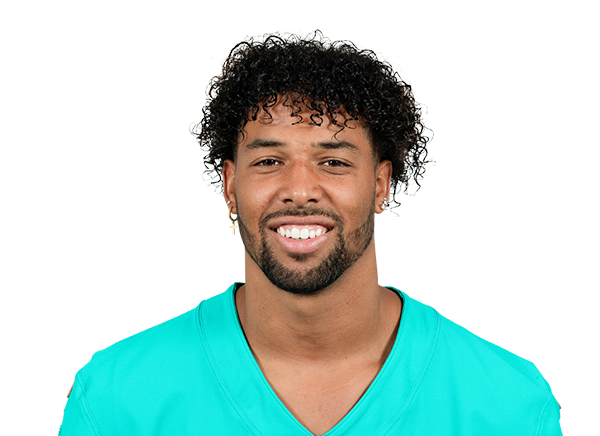 Brandon Jones |
22 | S | Active | 6' 0" | 191 lbs | 7 | Texas |
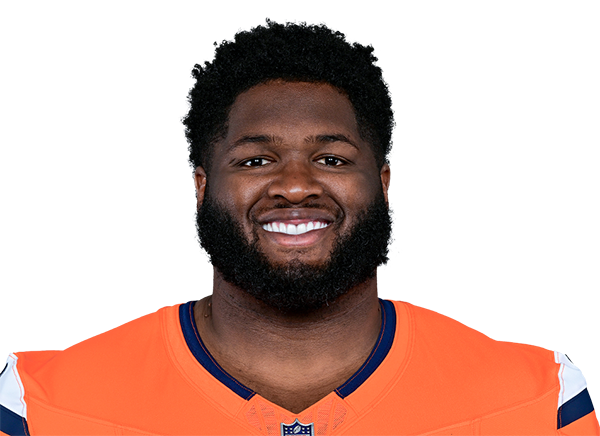 D.J. Jones |
93 | DT | Active | 6' 0" | 305 lbs | 10 | Ole Miss |
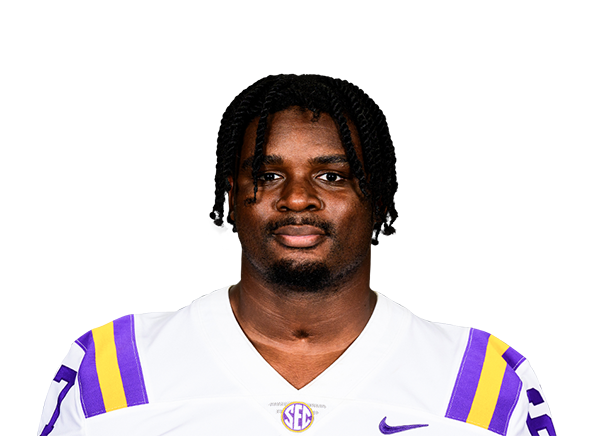 Sai'vion Jones |
95 | DE | Active | 6' 5" | 289 lbs | 2 | LSU |
 Kolbe Katsis |
81 | WR | Active | 6' 1" | 185 lbs | R | Northern Arizona |
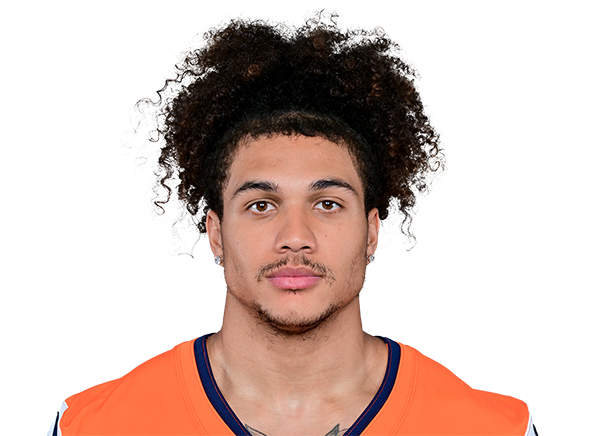 Devon Key |
26 | S | Active | 6' 0" | 208 lbs | 3 | Western Kentucky |
 Dane Key |
32 | WR | Practice Squad | 6' 3" | 210 lbs | R | Nebraska |
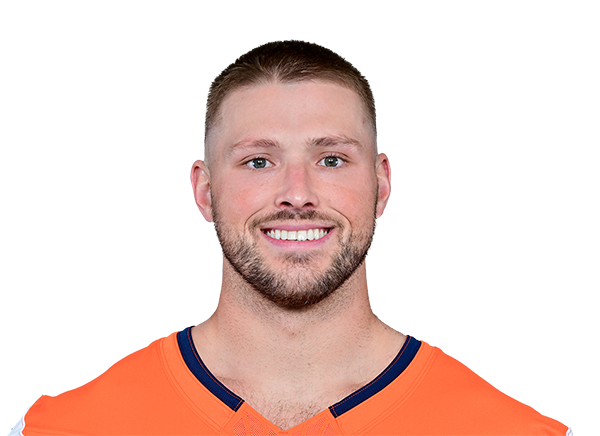 Lucas Krull |
85 | TE | Practice Squad | 6' 6" | 260 lbs | 4 | Pittsburgh |
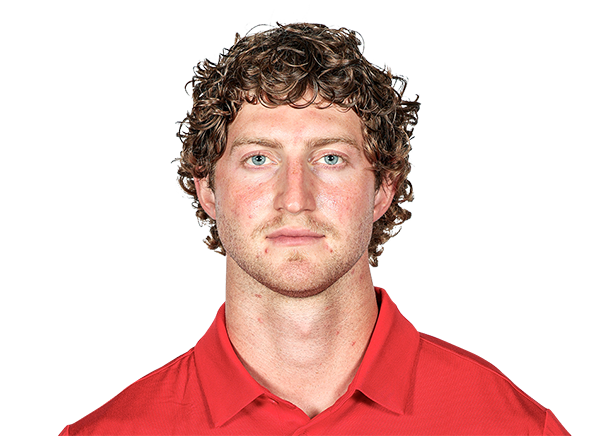 Caleb Lohner |
84 | TE | Day-To-Day | 6' 7" | 250 lbs | 1 | Utah |
 Wil Lutz |
3 | PK | Active | 5' 11" | 184 lbs | 11 | Georgia State |
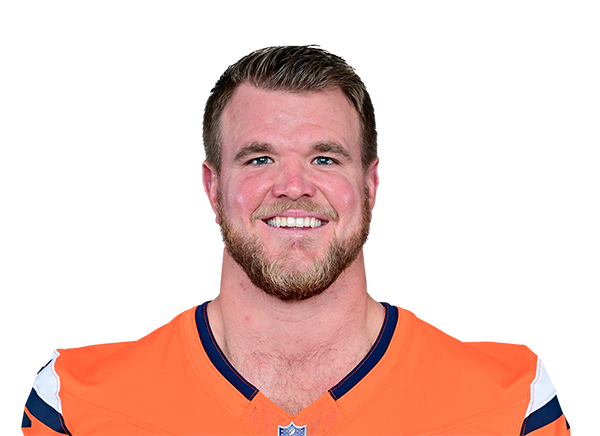 Mike McGlinchey |
69 | OT | Active | 6' 8" | 315 lbs | 9 | Notre Dame |
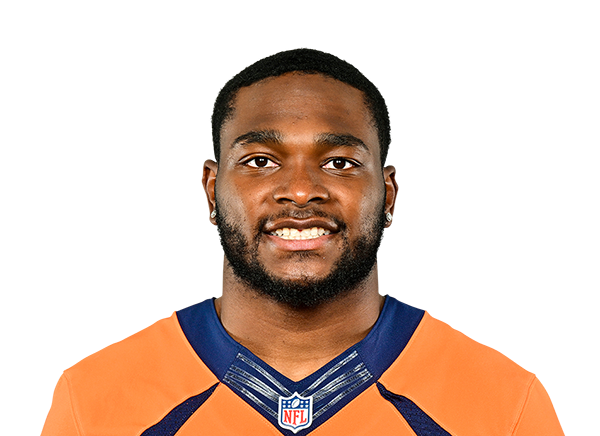 Ja'Quan McMillian |
29 | CB | Active | 5' 10" | 183 lbs | 4 | East Carolina |
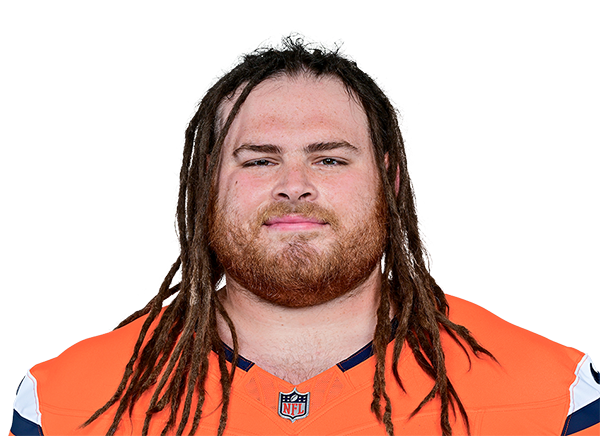 Quinn Meinerz |
77 | G | Active | 6' 3" | 320 lbs | 6 | Wisconsin Whitewater |
 Tyler Miller |
71 | OT | Practice Squad | 6' 9" | 335 lbs | R | Iowa State |
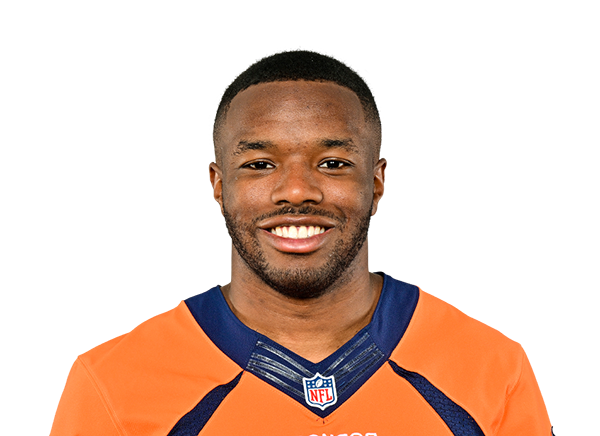 Marvin Mims Jr. |
19 | WR | Active | 5' 11" | 182 lbs | 4 | Oklahoma |
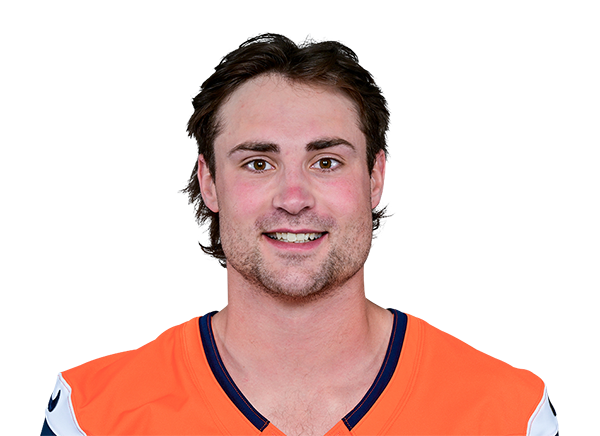 Riley Moss |
21 | CB | Active | 6' 0" | 193 lbs | 4 | Iowa |
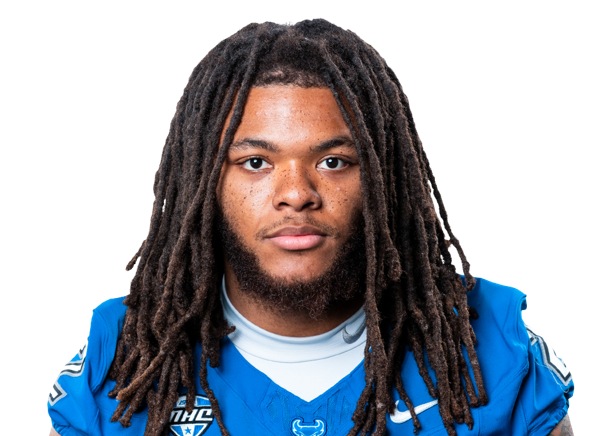 Red Murdock |
50 | LB | Practice Squad | 6' 1" | 232 lbs | R | Buffalo |
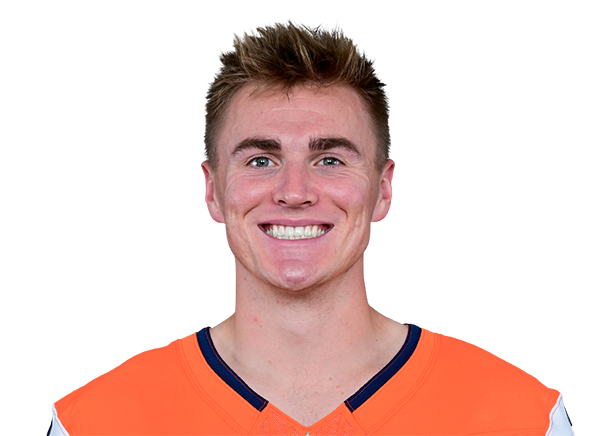 Bo Nix |
10 | QB | Active | 6' 2" | 217 lbs | 3 | Oregon |
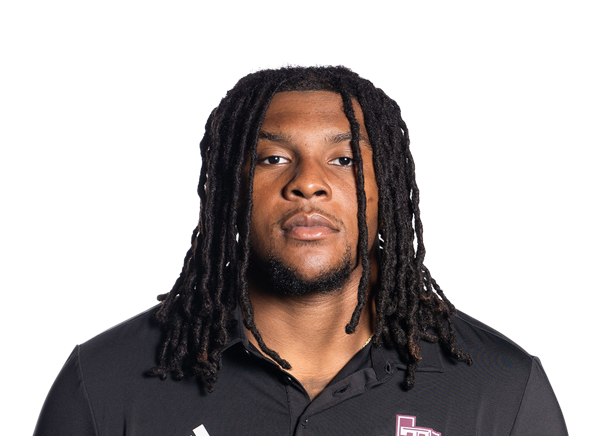 Tyler Onyedim |
98 | DT | Active | 6' 3" | 292 lbs | R | Texas A&M |
 Gavin Ortega |
68 | OT | Practice Squad | 6' 5" | 300 lbs | R | Weber State |
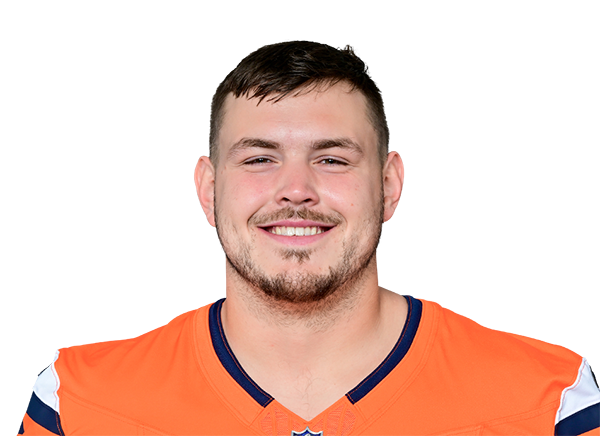 Alex Palczewski |
63 | OT | Active | 6' 6" | 314 lbs | 4 | Illinois |
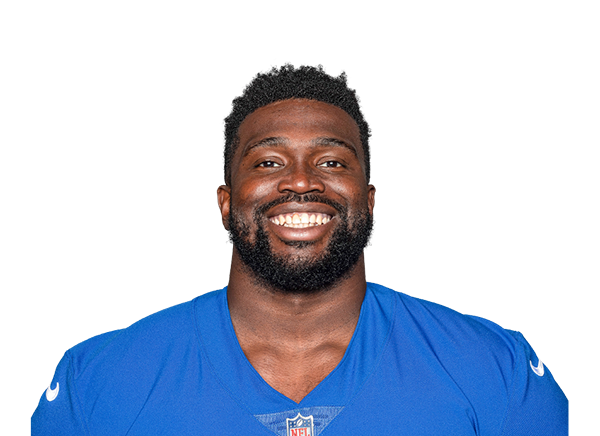 Matt Peart |
79 | OT | Active | 6' 7" | 318 lbs | 7 | UConn |
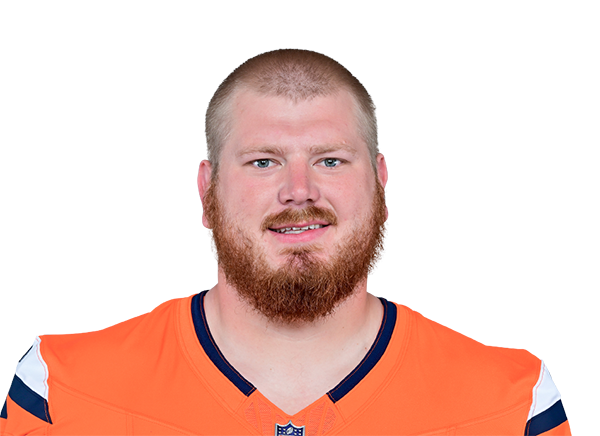 Ben Powers |
74 | G | Active | 6' 4" | 310 lbs | 8 | Oklahoma |
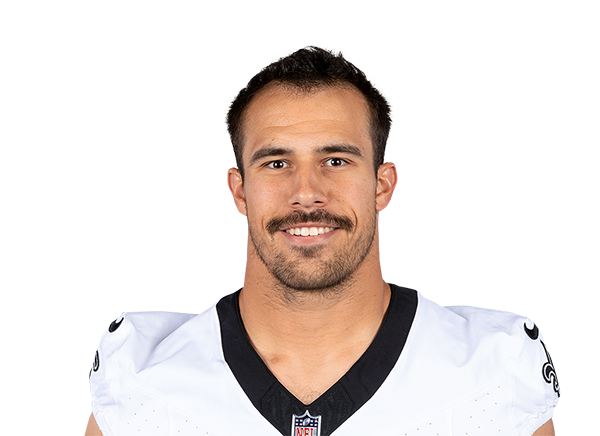 Adam Prentice |
46 | FB | Active | 6' 0" | 245 lbs | 6 | South Carolina |
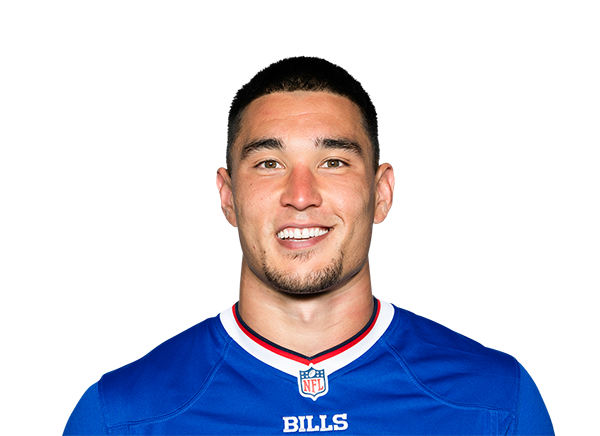 Taylor Rapp |
30 | S | Active | 6' 0" | 208 lbs | 8 | Washington |
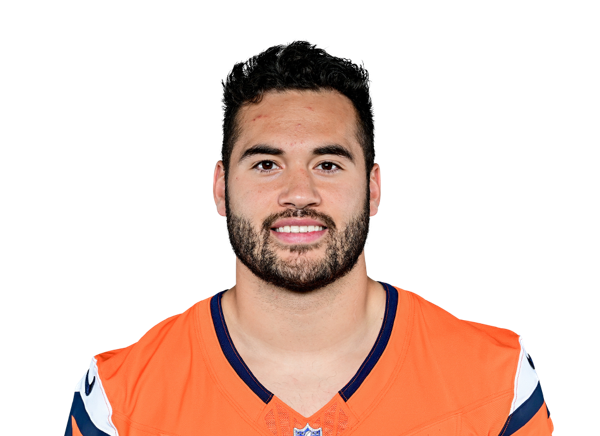 Karene Reid |
47 | LB | Active | 6' 0" | 226 lbs | 2 | Utah |
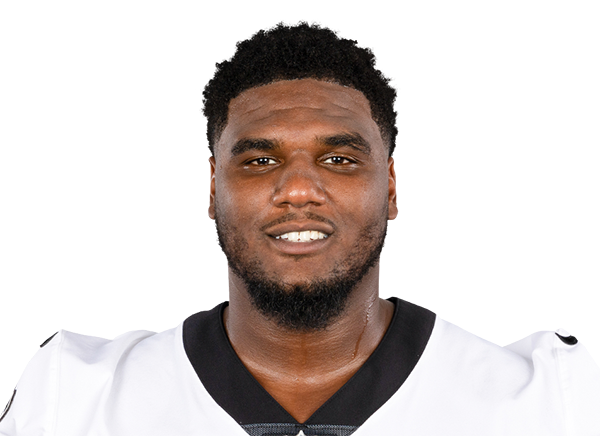 Malcolm Roach |
97 | DT | Active | 6' 3" | 290 lbs | 7 | Texas |
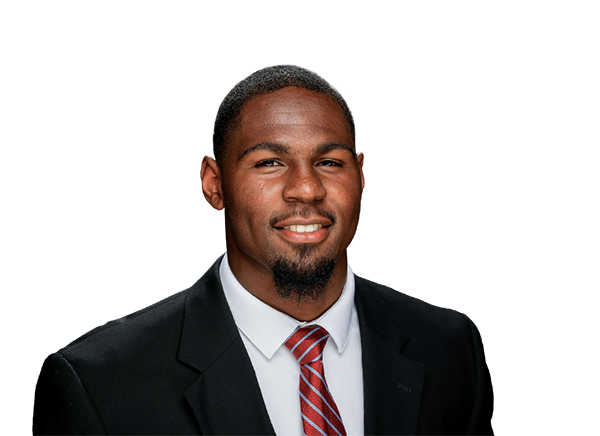 Que Robinson |
51 | LB | Active | 6' 4" | 243 lbs | 2 | Alabama |
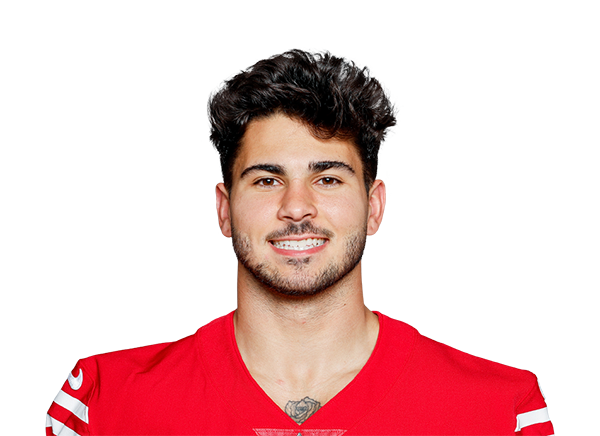 Cody Schrader |
25 | RB | Practice Squad | 5' 9" | 214 lbs | 3 | Missouri |
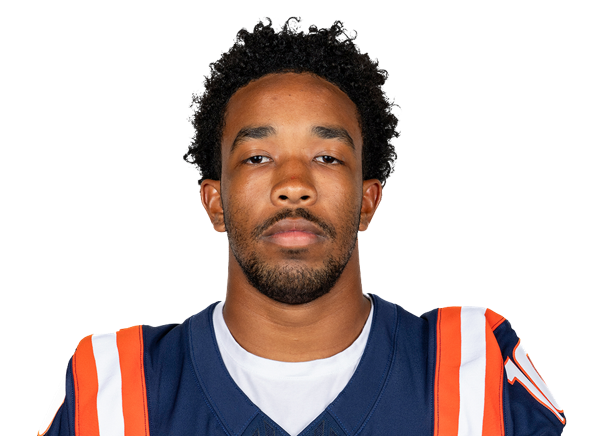 Miles Scott |
39 | S | Practice Squad | 5' 11" | 210 lbs | R | Illinois |
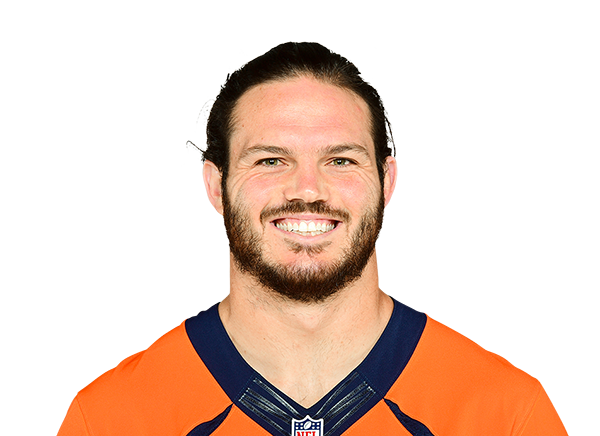 Alex Singleton |
49 | LB | Active | 6' 2" | 240 lbs | 8 | Montana State |
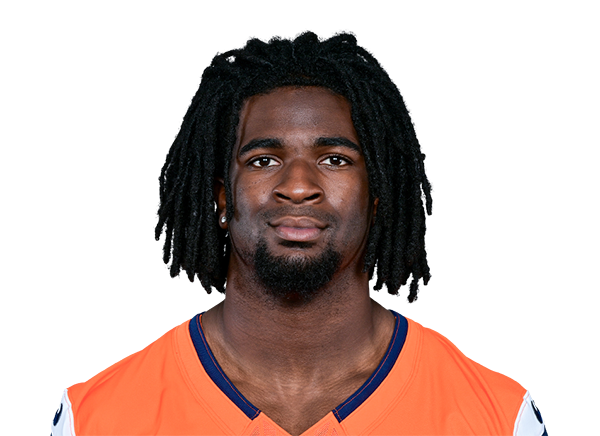 JL Skinner |
34 | S | Active | 6' 4" | 220 lbs | 4 | Boise State |
 Jarrett Stidham |
8 | QB | Active | 6' 3" | 215 lbs | 7 | Auburn |
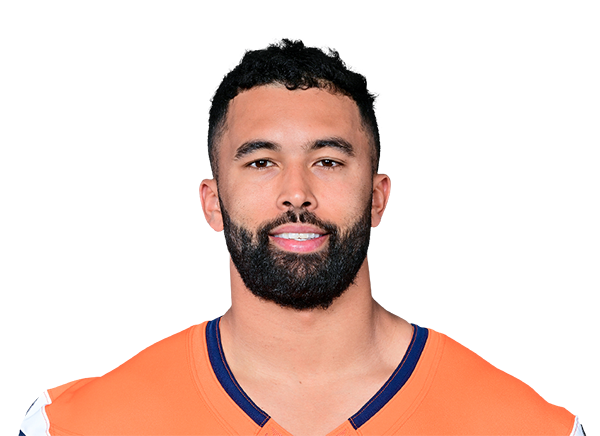 Justin Strnad |
40 | LB | Active | 6' 3" | 235 lbs | 7 | Wake Forest |
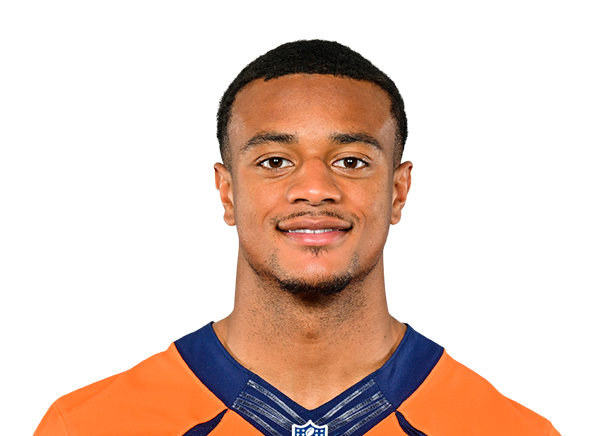 Pat Surtain II |
2 | CB | Active | 6' 2" | 202 lbs | 6 | Alabama |
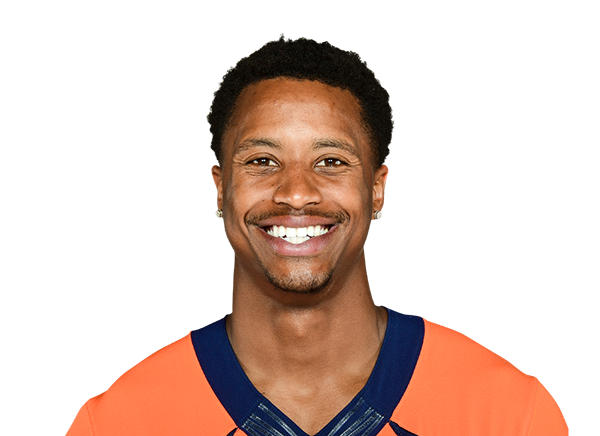 Courtland Sutton |
14 | WR | Active | 6' 4" | 216 lbs | 9 | SMU |
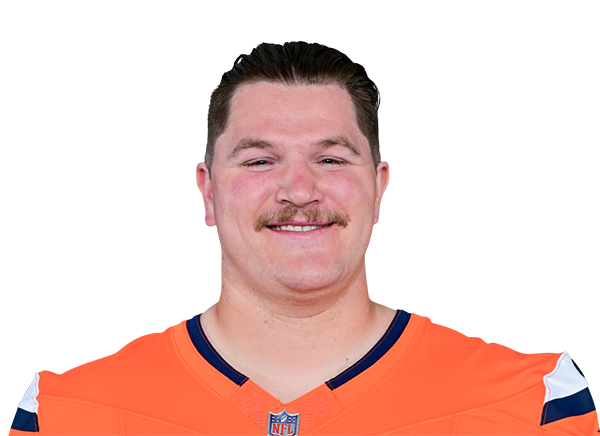 Calvin Throckmorton |
76 | G | Practice Squad | 6' 5" | 311 lbs | 6 | Oregon |
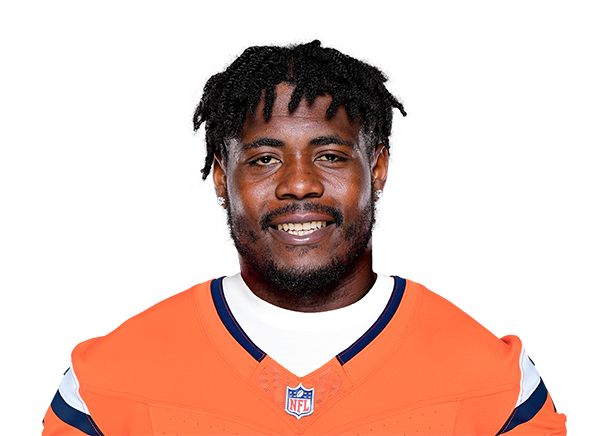 Dondrea Tillman |
92 | LB | Active | 6' 4" | 247 lbs | 3 | IU Pennsylvania |
 Adam Trautman |
82 | TE | Active | 6' 5" | 253 lbs | 7 | Dayton |
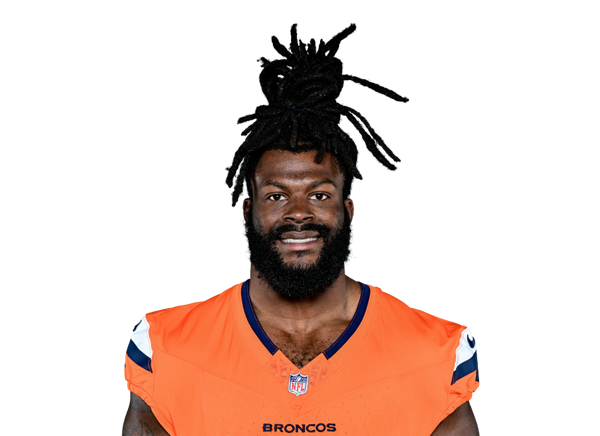 Jordan Turner |
55 | LB | Active | 6' 1" | 231 lbs | 2 | Michigan State |
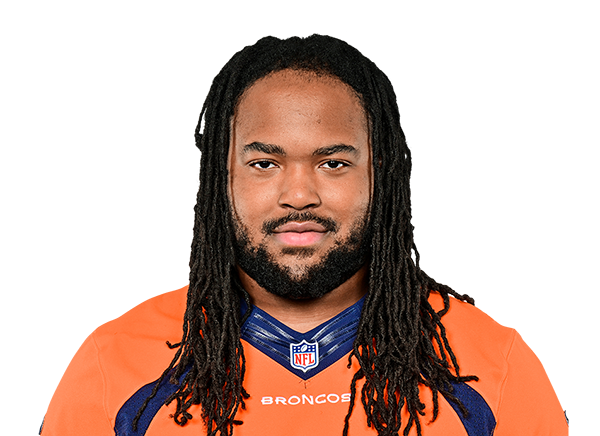 Eyioma Uwazurike |
96 | DE | Active | 6' 6" | 320 lbs | 4 | Iowa State |
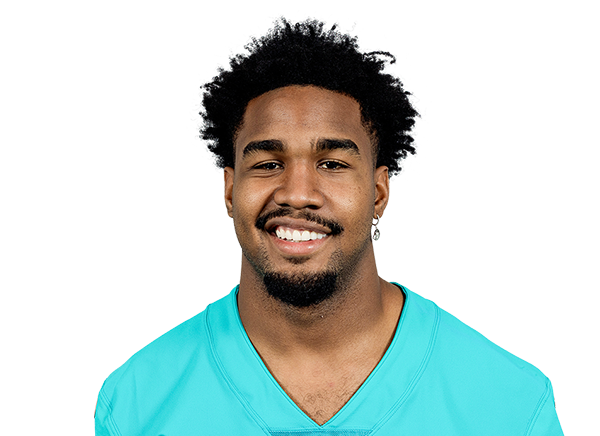 Jaylen Waddle |
17 | WR | Active | 5' 10" | 185 lbs | 6 | Alabama |
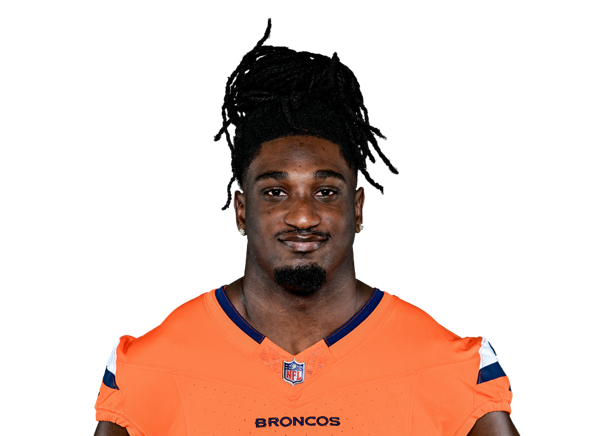 Johnny Walker |
59 | LB | Practice Squad | 6' 3" | 250 lbs | 2 | Missouri |
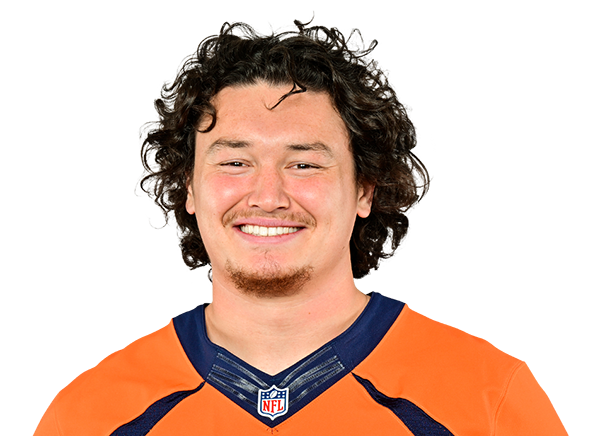 Luke Wattenberg |
60 | C | Active | 6' 5" | 300 lbs | 5 | Washington |
Denver Broncos — Stats
Team Scoring
| Wins | 4 |
| Losses | 2 |
| Ties | 0 |
| Win % | 0.6666667 |
| Points For | 114 |
| Points Against | 125 |
| Point Differential | -11 |
| Streak | 2 |
| Division Record | 0 |
Passing
| Completion Percentage | 60.3 |
| Completions | 114 |
| Interception Percentage | 1.60 |
| Interceptions | 3 |
| Longest Pass | 49 |
| Net Passing Yards | 1,008 |
| Net Passing Yards Per Game | 168.0 |
| Passing Attempts | 189 |
| Passing Touchdown % | 3.20 |
| Passing Touchdowns | 6 |
| Passer Rating | 79.4 |
| Total Sacks | 8 |
| Sack Yards Lost | 41 |
| Yards Per Pass Attempt | 5.6 |
| Passing Yards | 1,049 |
| Passing Fumbles Lost | 0 |
| Team Games Played | 6 |
| Yards Per Game | 259.0 |
| Total Points Per Game | 19.0 |
| Total Points | 114 |
| Total Touchdowns | 12 |
| Passing Yards Per Game | 174.8 |
| Comp-Att | 114-189 |
| Sacks-Yards Lost | 8-41 |
Rushing
| Rushing Attempts | 147 |
| Rushing Yards | 505 |
| Yards Per Rush Attempt | 3.4 |
| Long Rushing | 17 |
| 20+ Yard Rushing Plays | 0 |
| Rushing Touchdowns | 5 |
| Rushing Yards Per Game | 84.2 |
| Rushing Fumbles | 2 |
| Rushing Fumbles Lost | 1 |
| Rushing 1st downs | 33 |
| Team Games Played | 6 |
| Total Yards | 1,554 |
| Total Offensive Plays | 344 |
| Total Points Per Game | 19.0 |
| Total Points | 114 |
| Total Touchdowns | 12 |
Receiving
| Receptions | 114 |
| Receiving Targets | 171 |
| Receiving Yards | 1,049 |
| Receiving Yards | 1,049 |
| Receiving Touchdowns | 6 |
| Long Reception | 49 |
| 20+ Yard Receiving Plays | 11 |
| Receiving Yards Per Game | 174.8 |
| Receiving Fumbles | 1 |
| Receiving Fumbles Lost | 0 |
| Receiving Yards After Catch | 633 |
| Receiving First Downs | 50 |
| Team Games Played | 6 |
| Yards Per Reception | 9.2 |
| Total Points Per Game | 19.0 |
| Total Points | 114 |
| Total Touchdowns | 12 |
Miscellaneous
| Total 1st downs | 98 |
| Rushing 1st downs | 33 |
| Passing 1st downs | 50 |
| 1st downs by penalty | 15 |
| Third Down Conversions | 25 |
| Third Down Attempts | 79 |
| 3rd down % | 31.65 |
| Fourth Down Conversions | 3 |
| First Downs Attempts | 4 |
| 4th down % | 75.00 |
| Total Penalties | 44 |
| Total Penalty Yards | 269 |
| Possession Time Seconds | 10355 |
| Red Zone Field Goal Percentage | 27.78 |
| Red Zone Scoring Percentage | 88.89 |
| Red Zone Efficiency Percentage | 73.02 |
| Red Zone Touchdown Percentage | 61.11 |
| Total Takeaways | 10 |
| Total Giveaways | 6 |
| Turnover Ratio | 4 |
| Fumbles Lost | 3 |
| 3rd down efficiency | 25-79 |
| 4th down efficiency | 3-4 |
| Total-Yards | 44-269 |
Defense
| Solo Tackles | 247 |
| Assist Tackles | 182 |
| Total Tackles | 429 |
| Sacks | 18 |
| Sack Yards | 129 |
| Stuffs | 31 |
| Passes Defended | 34 |
| Average Interception Yards | 14.3 |
| Long Interception | 66 |
| Miscellaneous Touchdowns | 0 |
| Kicks Blocked | 1 |
| Tackles For Loss | 36 |
| Team Games Played | 6 |
Defensive Interceptions
| Interceptions | 7 |
| Interception Yards | 100 |
| Interception Touchdowns | 1 |
| INT: Total | 7-100 |
General
| Fumbles | 11 |
| Forced Fumbles | 8 |
| Fumbles Recovered | 3 |
| Fumbles Touchdowns | 0 |
| Games Played | 6 |
| Fumbles-Lost | 11-3 |
Returning
| Kick Returns | 20 |
| Kick Return Yards | 529 |
| Yards Per Kick Return | 26.5 |
| Long Kick Return | 38 |
| Kick Return Touchdowns | 0 |
| Punt Returns | 11 |
| Punt Return Yards | 123 |
| Yards Per Punt Return | 11.2 |
| Long Punt Return | 28 |
| Punt Return Touchdowns | 0 |
| Punt Return Fair Catches | 8 |
| Kick Return Fumbles Lost | 0 |
| Punt Return Fumbles Lost | 0 |
| Team Games Played | 6 |
| Punt: Total | 11-123 |
Kicking
| Field Goal Made | 9 |
| Field Goal Attempts | 12 |
| Field Goal Percentage | 75.0 |
| Long Field Goal Made | 53 |
| Field Goal Attempts 1-19 | 1 |
| Field Goal Attempts 20-29 | 1 |
| Field Goal Attempts 30-39 | 3 |
| Field Goal Attempts 40-49 | 4 |
| Field Goal Attempts 50+ | 3 |
| Extra Points Made | 9 |
| Extra Point Attempts | 9 |
| Extra Point Percentage | 100.0 |
| Field Goals Made 1-19 | 1 |
| Field Goals Made 20-29 | 1 |
| Field Goals Made 30-39 | 3 |
| Field Goals Made 40-49 | 2 |
| Field Goals Made 50+ | 2 |
| Total Kicking Points | 36 |
| Team Games Played | 6 |
| Touchback Percentage | 7 |
| Average Kickoff Return Yards | 24.3 |
| Kickoff Return Yards | 582 |
| Kickoff Returns | 24 |
| Kickoffs: Total | 24-582 |
| FG: Good-Attempts | 9-12 |
Punting
| Punts | 32 |
| Punt Yards | 1,568 |
| Long Punt | 68 |
| Gross Average Punt Yards | 49.0 |
| Net Average Punt Yards | 45.9 |
| Punts Blocked | 0 |
| Punts Inside 20 | 14 |
| Touchbacks | 2 |
| Fair Catches | 7 |
| Punt Returns | 11 |
| Punt Return Yards | 98 |
| Average Punt Return Yards | 8.9 |
| Team Games Played | 6 |
| Punt: Total Yards | 32-1,568 |
Scoring
| Rushing Touchdowns | 5 |
| Receiving Touchdowns | 6 |
| Return Touchdowns | 1 |
| Total Touchdowns | 11 |
| Field Goals | 9 |
| Kick Extra Points | 9 |
| Total Two Point Conversions | 3 |
| Total Points | 114 |
| Total Points Per Game | 19.0 |
Passing
| Completion Percentage | 56.5 |
| Completions | 122 |
| Interception Percentage | 3.24 |
| Interceptions | 7 |
| Longest Pass | 59 |
| Net Passing Yards | 1,251 |
| Net Passing Yards Per Game | 208.5 |
| Passing Attempts | 216 |
| Passing Touchdown % | 3.24 |
| Passing Touchdowns | 7 |
| Passer Rating | 73.1 |
| Total Sacks | 18 |
| Sack Yards Lost | 129 |
| Yards Per Pass Attempt | 6.4 |
| Passing Yards | 1,380 |
| Passing Fumbles Lost | 1 |
| Team Games Played | 6 |
| Yards Per Game | 369.8 |
| Total Points Per Game | 20.8 |
| Total Points | 125 |
| Total Touchdowns | 13 |
| Passing Yards Per Game | 230.0 |
| Comp-Att | 122-216 |
| Sacks-Yards Lost | 18-129 |
Rushing
| Rushing Attempts | 180 |
| Rushing Yards | 839 |
| Yards Per Rush Attempt | 4.7 |
| Long Rushing | 60 |
| 20+ Yard Rushing Plays | 7 |
| Rushing Touchdowns | 6 |
| Rushing Yards Per Game | 139.8 |
| Rushing Fumbles | 1 |
| Rushing Fumbles Lost | 1 |
| Rushing 1st downs | 51 |
| Team Games Played | 6 |
| Total Yards | 2,219 |
| Total Offensive Plays | 414 |
| Total Points Per Game | 20.8 |
| Total Points | 125 |
| Total Touchdowns | 13 |
Receiving
| Receptions | 122 |
| Receiving Targets | 199 |
| Receiving Yards | 1,380 |
| Receiving Yards | 1,380 |
| Receiving Touchdowns | 7 |
| Long Reception | 59 |
| 20+ Yard Receiving Plays | 15 |
| Receiving Yards Per Game | 230.0 |
| Receiving Fumbles | 1 |
| Receiving Fumbles Lost | 1 |
| Receiving Yards After Catch | 587 |
| Receiving First Downs | 63 |
| Team Games Played | 6 |
| Yards Per Reception | 11.3 |
| Total Points Per Game | 20.8 |
| Total Points | 125 |
| Total Touchdowns | 13 |
Miscellaneous
| Total 1st downs | 124 |
| Rushing 1st downs | 51 |
| Passing 1st downs | 63 |
| 1st downs by penalty | 10 |
| Third Down Conversions | 40 |
| Third Down Attempts | 90 |
| 3rd down % | 44.44 |
| Fourth Down Conversions | 5 |
| First Downs Attempts | 9 |
| 4th down % | 55.56 |
| Total Penalties | 41 |
| Total Penalty Yards | 364 |
| Possession Time Seconds | 11552 |
| Red Zone Field Goal Percentage | 35.29 |
| Red Zone Scoring Percentage | 88.24 |
| Red Zone Efficiency Percentage | 68.07 |
| Red Zone Touchdown Percentage | 52.94 |
| Total Takeaways | 6 |
| Total Giveaways | 10 |
| Turnover Ratio | -4 |
| Fumbles Lost | 3 |
| 3rd down efficiency | 40-90 |
| 4th down efficiency | 5-9 |
| Total-Yards | 41-364 |
Defense
| Solo Tackles | 201 |
| Assist Tackles | 172 |
| Total Tackles | 373 |
| Sacks | 8 |
| Sack Yards | 41 |
| Stuffs | 22 |
| Passes Defended | 25 |
| Average Interception Yards | 10.3 |
| Long Interception | 26 |
| Miscellaneous Touchdowns | 0 |
| Kicks Blocked | 0 |
| Tackles For Loss | 13 |
| Team Games Played | 6 |
Defensive Interceptions
| Interceptions | 3 |
| Interception Yards | 31 |
| Interception Touchdowns | 0 |
| INT: Total | 3-31 |
General
| Fumbles | 9 |
| Forced Fumbles | 9 |
| Fumbles Recovered | 3 |
| Fumbles Touchdowns | 0 |
| Games Played | 6 |
| Fumbles-Lost | 9-3 |
Returning
| Kick Returns | 24 |
| Kick Return Yards | 582 |
| Yards Per Kick Return | 24.3 |
| Long Kick Return | 39 |
| Kick Return Touchdowns | 0 |
| Punt Returns | 11 |
| Punt Return Yards | 98 |
| Yards Per Punt Return | 8.9 |
| Long Punt Return | 31 |
| Punt Return Touchdowns | 0 |
| Punt Return Fair Catches | 7 |
| Kick Return Fumbles Lost | 0 |
| Punt Return Fumbles Lost | 0 |
| Team Games Played | 6 |
| Punt: Total | 11-98 |
Kicking
| Field Goal Made | 11 |
| Field Goal Attempts | 14 |
| Field Goal Percentage | 78.6 |
| Long Field Goal Made | 55 |
| Field Goal Attempts 1-19 | 0 |
| Field Goal Attempts 20-29 | 3 |
| Field Goal Attempts 30-39 | 3 |
| Field Goal Attempts 40-49 | 5 |
| Field Goal Attempts 50+ | 3 |
| Extra Points Made | 12 |
| Extra Point Attempts | 12 |
| Extra Point Percentage | 100.0 |
| Field Goals Made 1-19 | 0 |
| Field Goals Made 20-29 | 3 |
| Field Goals Made 30-39 | 3 |
| Field Goals Made 40-49 | 4 |
| Field Goals Made 50+ | 1 |
| Total Kicking Points | 45 |
| Team Games Played | 6 |
| Touchback Percentage | 29 |
| Average Kickoff Return Yards | 26.5 |
| Kickoff Return Yards | 529 |
| Kickoff Returns | 20 |
| Kickoffs: Total | 20-529 |
| FG: Good-Attempts | 11-14 |
Punting
| Punts | 26 |
| Punt Yards | 1,246 |
| Long Punt | 63 |
| Gross Average Punt Yards | 47.9 |
| Net Average Punt Yards | 43.2 |
| Punts Blocked | 0 |
| Punts Inside 20 | 12 |
| Touchbacks | 0 |
| Fair Catches | 8 |
| Punt Returns | 11 |
| Punt Return Yards | 123 |
| Average Punt Return Yards | 11.2 |
| Team Games Played | 6 |
| Punt: Total Yards | 26-1,246 |
Scoring
| Rushing Touchdowns | 6 |
| Receiving Touchdowns | 7 |
| Return Touchdowns | 0 |
| Total Touchdowns | 13 |
| Field Goals | 11 |
| Kick Extra Points | 12 |
| Total Two Point Conversions | 1 |
| Total Points | 125 |
| Total Points Per Game | 20.8 |


