Recent Results
| Date | Matchup | Result / Time |
|---|---|---|
| Oct 18, 2026 | Philadelphia Eagles vs Carolina Panthers | Sun, Oct 18 1:00 PM ET |
| Oct 11, 2026 | Philadelphia Eagles @ Jacksonville Jaguars | Sun, Oct 11 9:30 AM ET |
| Oct 4, 2026 | Philadelphia Eagles vs Los Angeles Rams | Sun, Oct 4 1:00 PM ET |
Upcoming Games
| Date | Matchup | Result / Time |
|---|---|---|
| Oct 26, 2026 | Philadelphia Eagles vs Dallas Cowboys | Mon, Oct 26 8:15 PM ET |
| Nov 1, 2026 | Philadelphia Eagles @ Washington Commanders | Sun, Nov 1 8:20 PM ET |
| Nov 8, 2026 | Philadelphia Eagles vs New York Giants | Sun, Nov 8 1:00 PM ET |

Philadelphia Eagles
2-4
🏟 Lincoln Financial Field
Division Standings
| Team | W | L | T | PCT | DIV | PF | PA | STRK |
|---|---|---|---|---|---|---|---|---|
| San Francisco 49ers | 6 | 0 | 0 | 1.000 | - | 177 | 110 | W6 |
| Minnesota Vikings | 5 | 0 | 0 | 1.000 | - | 109 | 64 | W5 |
| Chicago Bears | 5 | 2 | 0 | .714 | - | 180 | 143 | W2 |
| Green Bay Packers | 4 | 2 | 0 | .667 | - | 127 | 125 | W3 |
| Carolina Panthers | 3 | 2 | 0 | .600 | - | 146 | 123 | W2 |
| Detroit Lions | 3 | 2 | 0 | .600 | - | 164 | 148 | W1 |
| New York Giants | 3 | 2 | 1 | .583 | - | 136 | 140 | L1 |
| Seattle Seahawks | 3 | 3 | 0 | .500 | - | 148 | 122 | L2 |
| Atlanta Falcons | 2 | 4 | 0 | .333 | - | 142 | 153 | L2 |
| New Orleans Saints | 2 | 4 | 0 | .333 | - | 152 | 178 | W1 |
| Philadelphia Eagles | 2 | 4 | 0 | .333 | - | 106 | 137 | L4 |
| Dallas Cowboys | 2 | 4 | 0 | .333 | - | 151 | 159 | L2 |
| Arizona Cardinals | 2 | 4 | 0 | .333 | - | 126 | 178 | W1 |
| Los Angeles Rams | 2 | 4 | 0 | .333 | - | 135 | 138 | L2 |
| Washington Commanders | 1 | 4 | 1 | .250 | - | 132 | 172 | L1 |
| Tampa Bay Buccaneers | 1 | 5 | 0 | .167 | - | 119 | 138 | L1 |
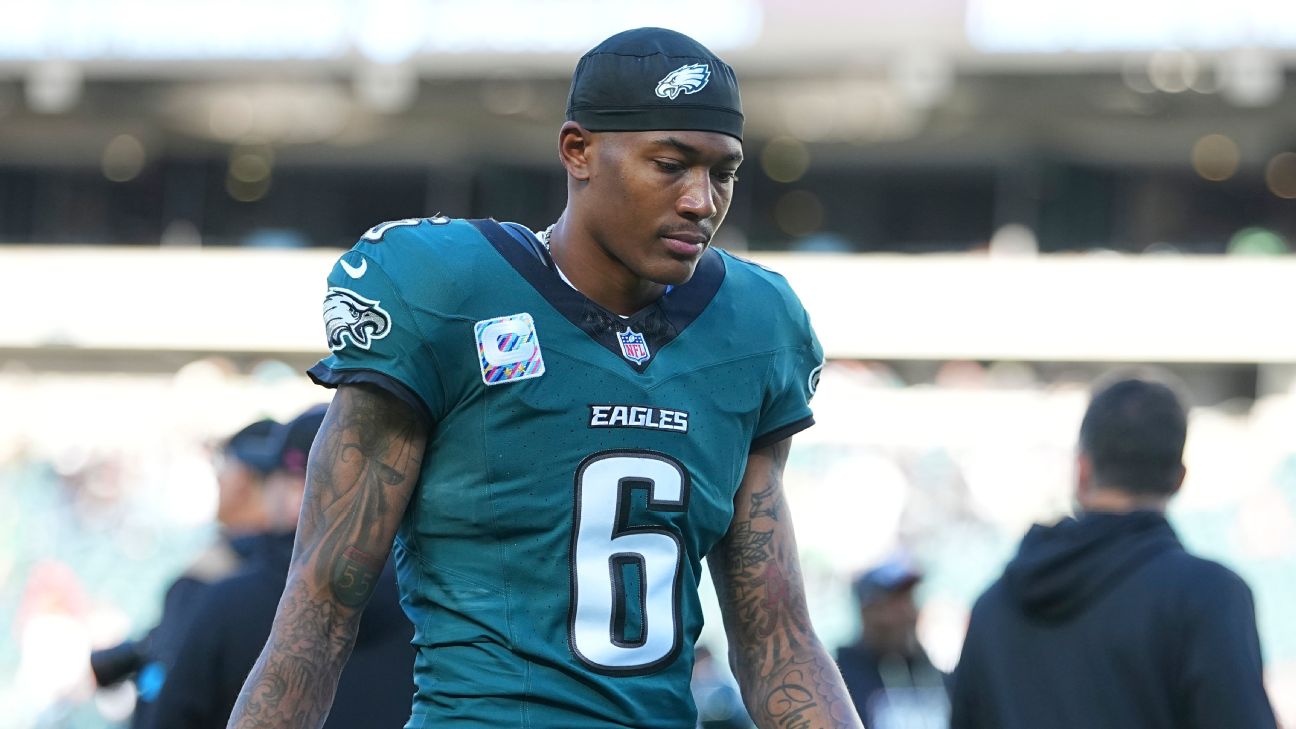
Eagles' DeVonta Smith, Dontayvion Wicks out vs. Cowboys
The Eagles' top two receivers -- DeVonta Smith and Dontayvion Wicks -- have been ruled out of Monday night's game against the Cowboys.
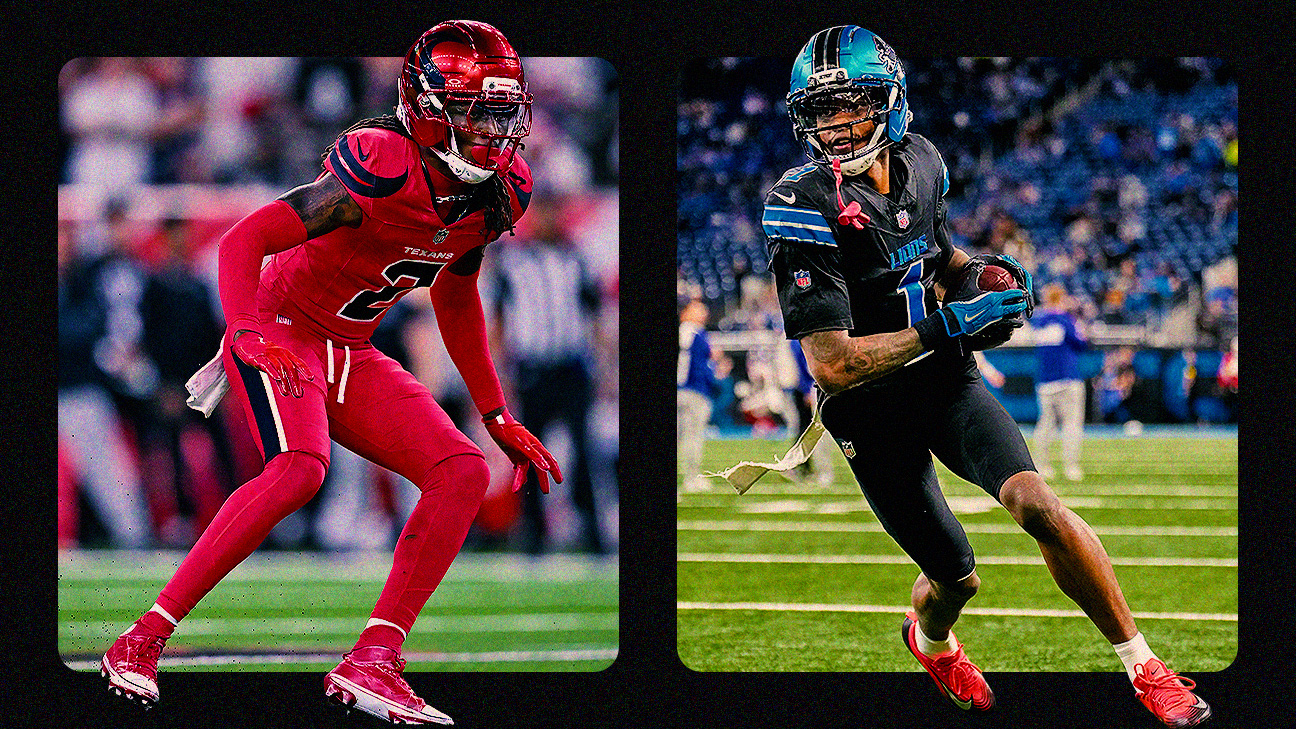
NFL Week 7 uniforms: Alternates galore as Texans go battle red, Lions all-black
Here's a look at what each NFL team is wearing in Week 7, led by alternate looks from Houston, Detroit and Dallas.
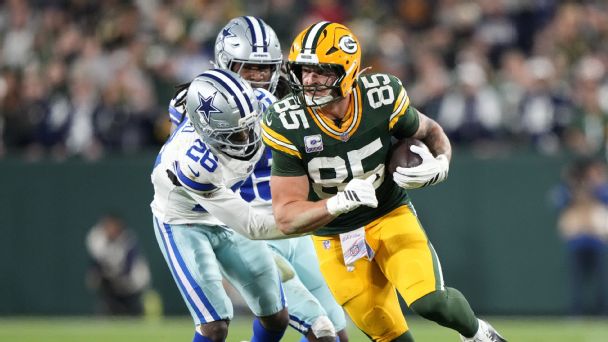
NFL Week 7 predictions: Upsets, fantasy sleepers, stat lines, TD scorers, more
Touchdowns for Tucker Kraft and Germie Bernard? Cardinals pull another upset? Revenge game for Trey Hendrickson? Let's predict 15 things for Week 7.
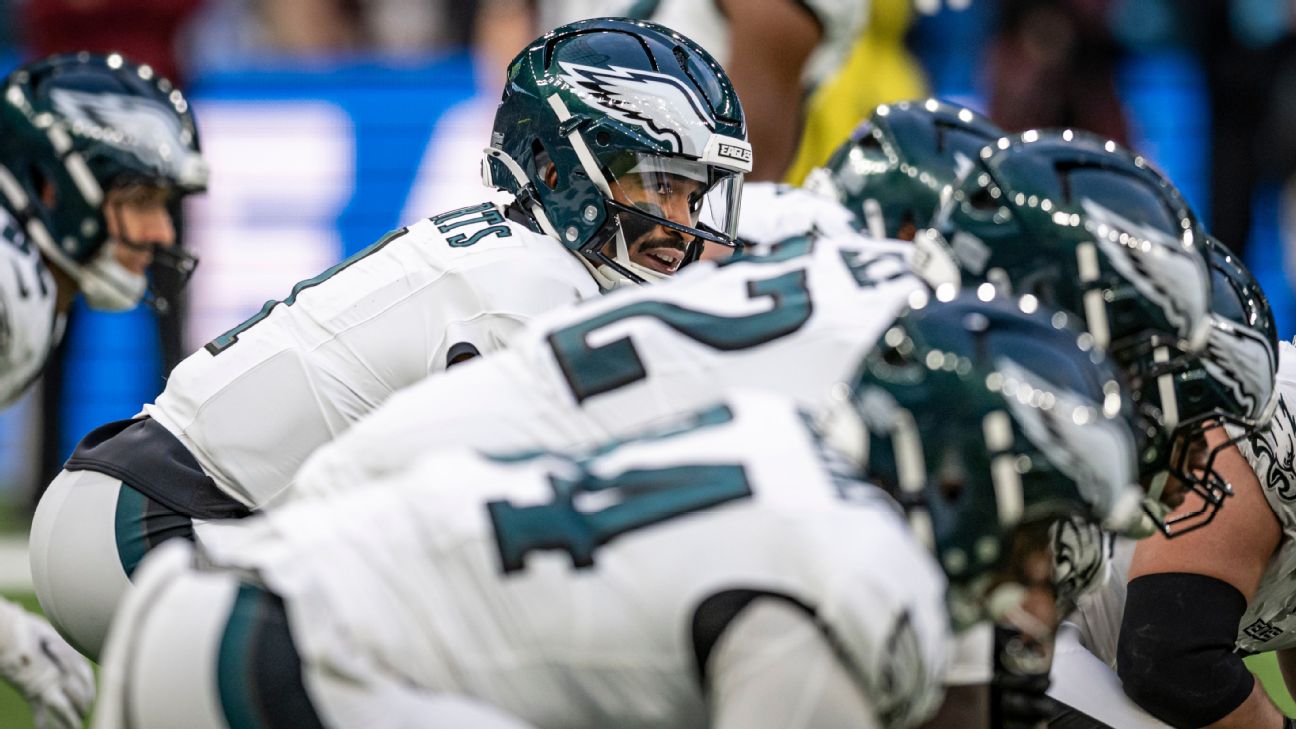
David Andrews' blood clot diagnosis illuminates what's going on with Jalen Hurts
The former NFL center tells ESPN about his experience as it might provide a window into the Eagles QB's situation.
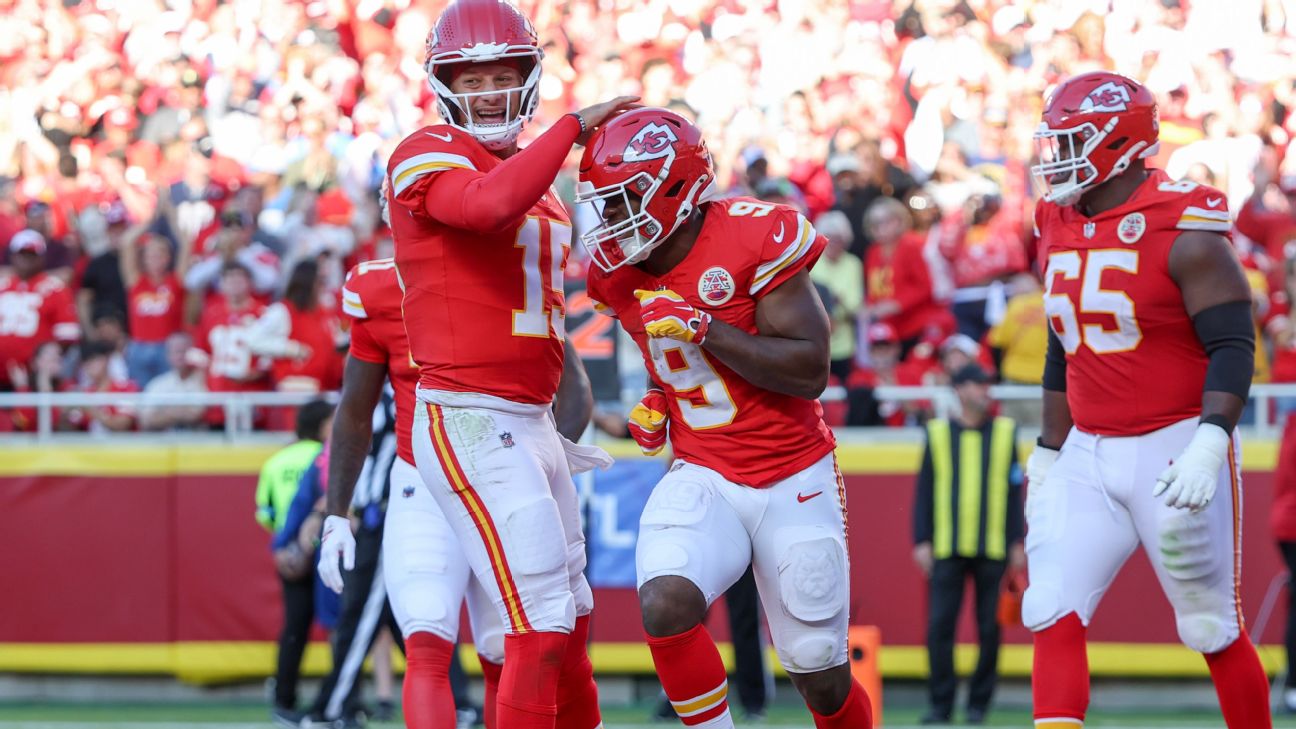
NFL Week 7 betting odds: Lines and totals for every game
A look at the odds, spreads, totals and FPI predictions for every NFL game in Week 7.

Jay-Z's greatest sports lyrics, ranked ahead of his SoFi Stadium show
Jay-Z's catalog is packed with sports references -- here are the ones that top our list.
What are the longest field goals in NFL history?
Timely field goals can change game trajectories in a dramatic fashion. Check out the longest field goals in NFL history now.
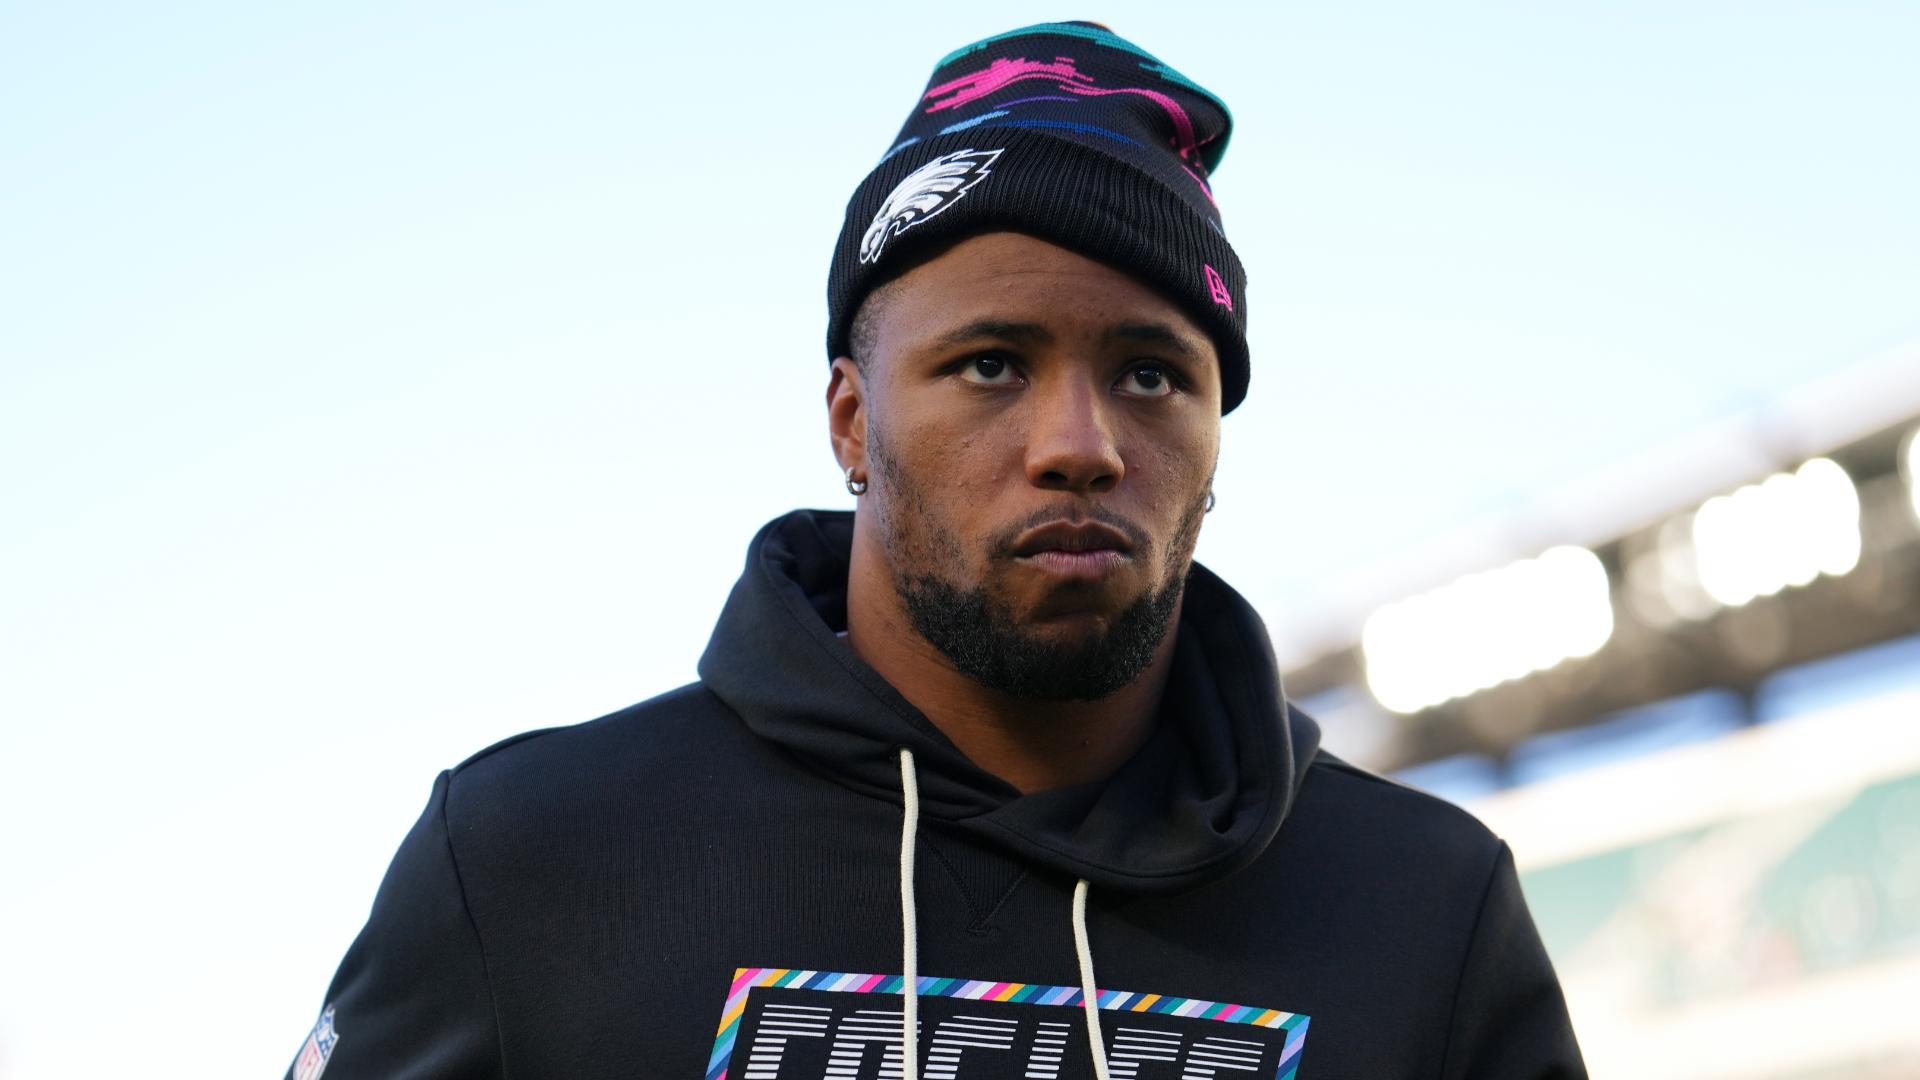
Saquon Barkley expected to play against Cowboys
Tim McManus breaks down Saquon Barkley's impact on the Eagles with his return.
| Date | Matchup | Result / Time |
|---|---|---|
| Sep 13, 2026 | Philadelphia Eagles vs Washington Commanders | Sun, Sep 13 4:25 PM ET |
| Sep 20, 2026 | Philadelphia Eagles @ Tennessee Titans | Sun, Sep 20 1:00 PM ET |
| Sep 28, 2026 | Philadelphia Eagles @ Chicago Bears | Mon, Sep 28 8:15 PM ET |
| Oct 4, 2026 | Philadelphia Eagles vs Los Angeles Rams | Sun, Oct 4 1:00 PM ET |
| Oct 11, 2026 | Philadelphia Eagles @ Jacksonville Jaguars | Sun, Oct 11 9:30 AM ET |
| Oct 18, 2026 | Philadelphia Eagles vs Carolina Panthers | Sun, Oct 18 1:00 PM ET |
| Oct 26, 2026 | Philadelphia Eagles vs Dallas Cowboys | Mon, Oct 26 8:15 PM ET |
| Nov 1, 2026 | Philadelphia Eagles @ Washington Commanders | Sun, Nov 1 8:20 PM ET |
| Nov 8, 2026 | Philadelphia Eagles vs New York Giants | Sun, Nov 8 1:00 PM ET |
| Nov 22, 2026 | Philadelphia Eagles vs Pittsburgh Steelers | Sun, Nov 22 4:25 PM ET |
| Nov 26, 2026 | Philadelphia Eagles @ Dallas Cowboys | Thu, Nov 26 4:30 PM ET |
| Dec 6, 2026 | Philadelphia Eagles @ Arizona Cardinals | Sun, Dec 6 4:05 PM ET |
| Dec 13, 2026 | Philadelphia Eagles vs Indianapolis Colts | Sun, Dec 13 1:00 PM ET |
| Dec 19, 2026 | Philadelphia Eagles vs Seattle Seahawks | Sat, Dec 19 5:00 PM ET |
| Dec 24, 2026 | Philadelphia Eagles vs Houston Texans | Thu, Dec 24 8:15 PM ET |
| Jan 3, 2027 | Philadelphia Eagles @ San Francisco 49ers | Sun, Jan 3 8:20 PM ET |
| Jan 10, 2027 | Philadelphia Eagles @ New York Giants | Sun, Jan 10 12:00 AM ET |
Roster
| Player | No | Pos | Status | Height | Weight | Experience | College |
|---|---|---|---|---|---|---|---|
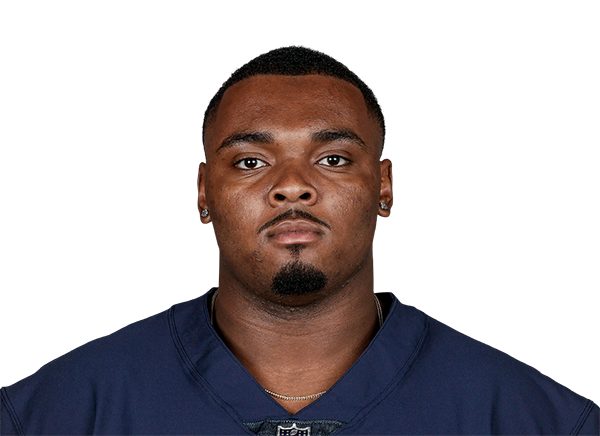 Kiran Amegadjie |
- | OT | Practice Squad | 6' 5" | 326 lbs | 3 | Yale |
 Saquon Barkley |
26 | RB | Active | 6' 0" | 233 lbs | 9 | Penn State |
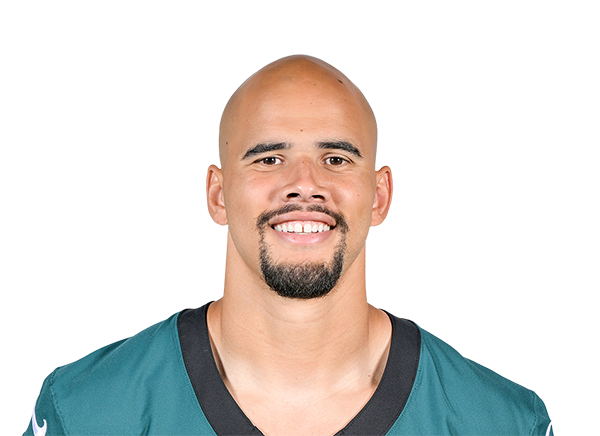 Zack Baun |
53 | LB | Active | 6' 3" | 225 lbs | 7 | Wisconsin |
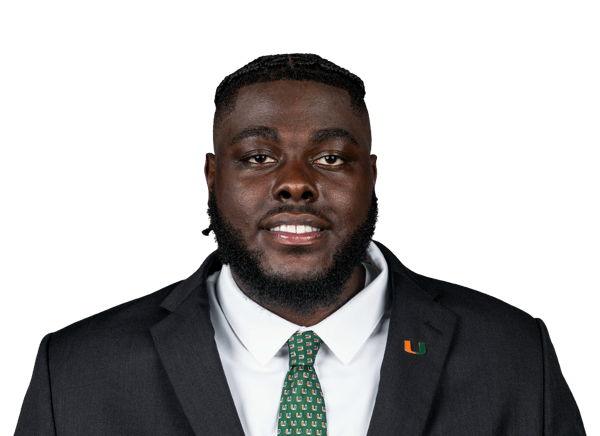 Markel Bell |
72 | OT | Active | 6' 9" | 346 lbs | R | Miami |
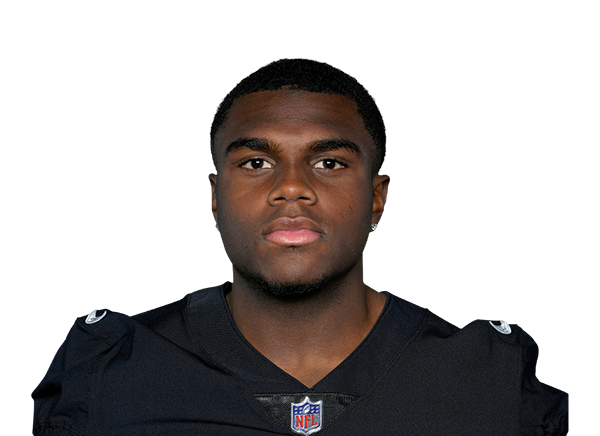 Jakorian Bennett |
23 | CB | Day-To-Day | 5' 10" | 200 lbs | 4 | Maryland |
 Uar Bernard |
93 | DT | Practice Squad | 6' 4" | 306 lbs | R | - |
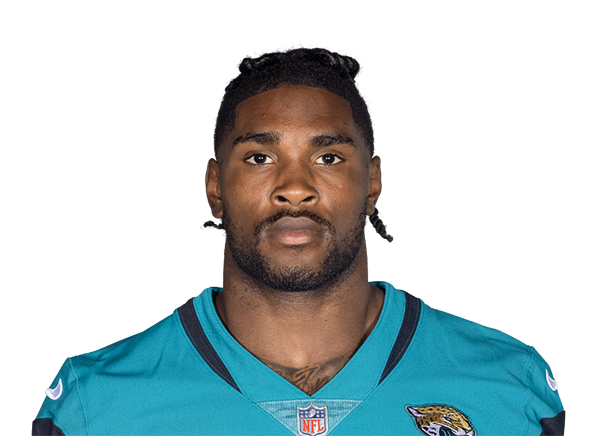 Tank Bigsby |
8 | RB | Active | 5' 11" | 215 lbs | 4 | Auburn |
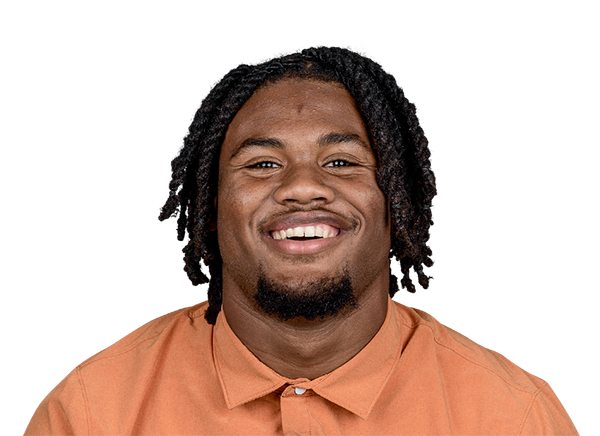 Jaydon Blue |
30 | RB | Practice Squad | 5' 9" | 198 lbs | 2 | Texas |
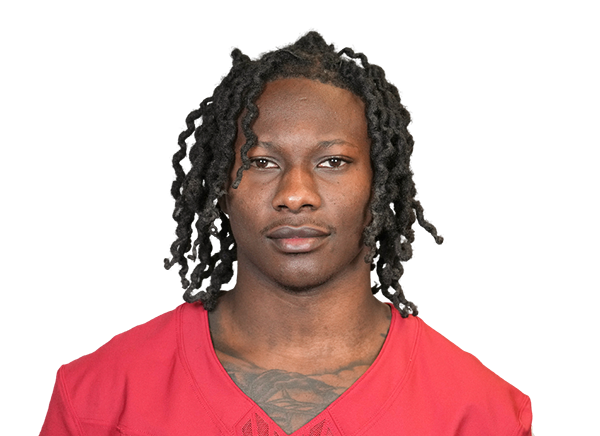 Hollywood Brown |
0 | WR | Active | 5' 9" | 170 lbs | 8 | Oklahoma |
 Grant Calcaterra |
81 | TE | Day-To-Day | 6' 4" | 240 lbs | 5 | SMU |
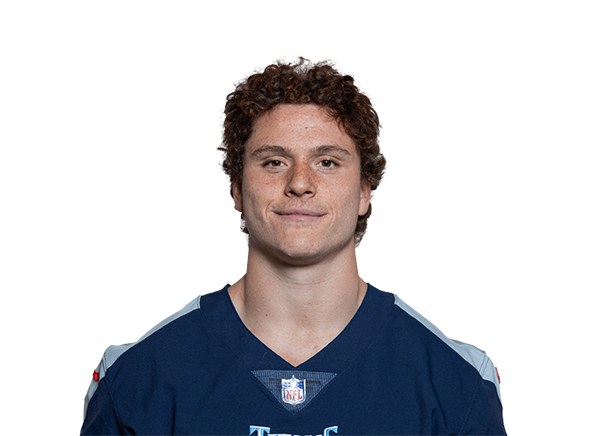 Chance Campbell |
59 | LB | Active | 6' 2" | 232 lbs | 4 | Ole Miss |
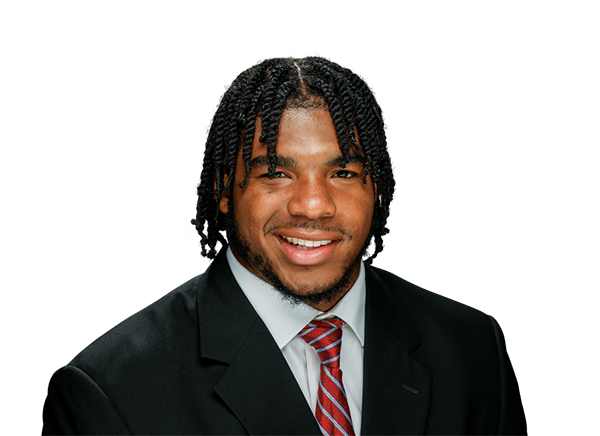 Jihaad Campbell |
11 | LB | Active | 6' 3" | 235 lbs | 2 | Alabama |
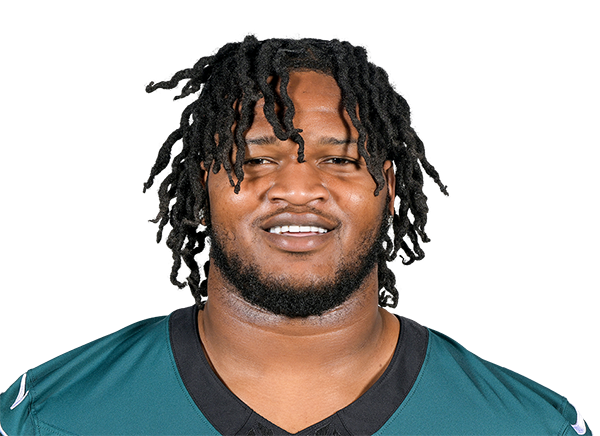 Jalen Carter |
98 | DT | Active | 6' 3" | 314 lbs | 4 | Georgia |
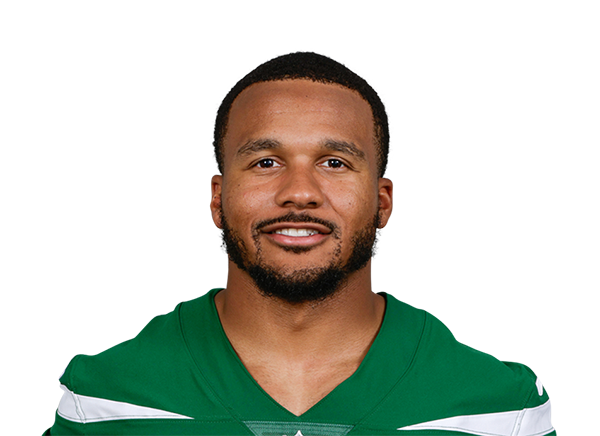 Michael Carter II |
35 | CB | Active | 5' 10" | 184 lbs | 6 | Duke |
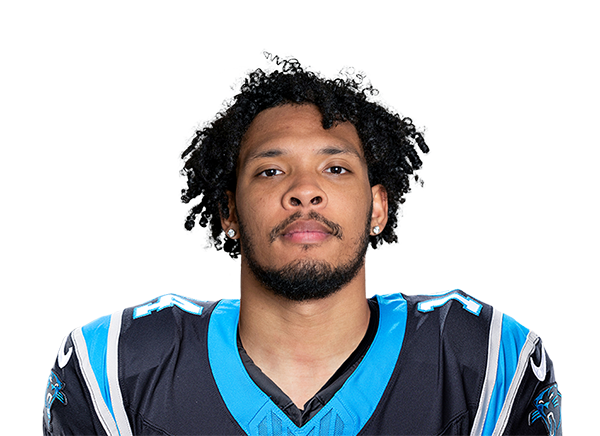 Tariq Castro-Fields |
41 | CB | Day-To-Day | 6' 1" | 197 lbs | 3 | Penn State |
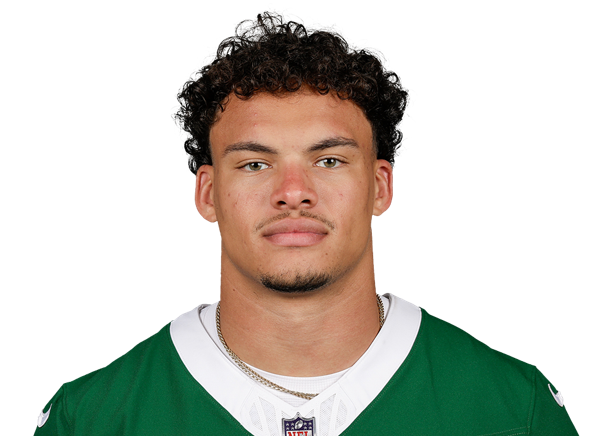 Dean Clark |
- | S | Practice Squad | 6' 1" | 206 lbs | 2 | Fresno State |
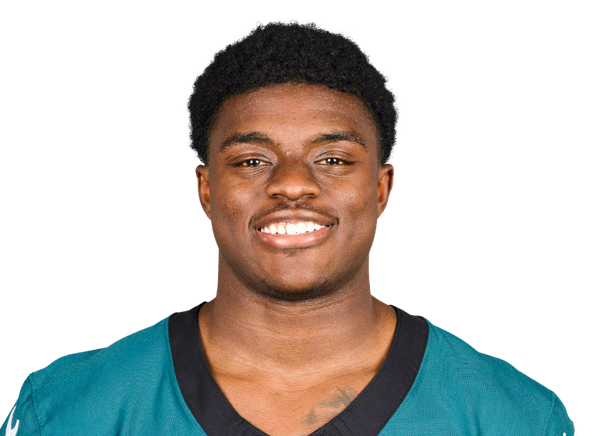 Darius Cooper |
80 | WR | Active | 5' 11" | 210 lbs | 2 | Tarleton State |
 Britain Covey |
85 | WR | Active | 5' 8" | 173 lbs | 5 | Utah |
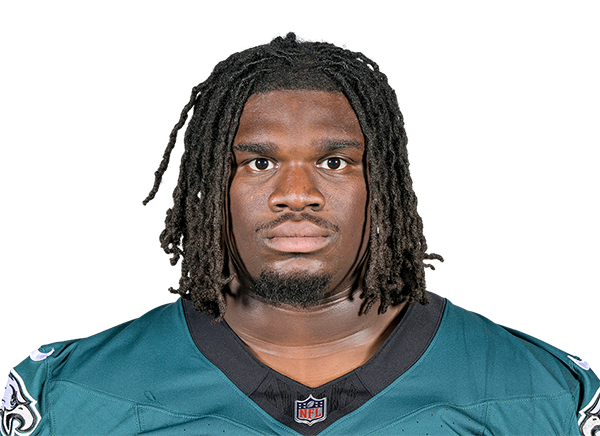 Jordan Davis |
90 | DT | Active | 6' 6" | 336 lbs | 5 | Georgia |
 Cooper DeJean |
33 | CB | Active | 6' 0" | 198 lbs | 3 | Iowa |
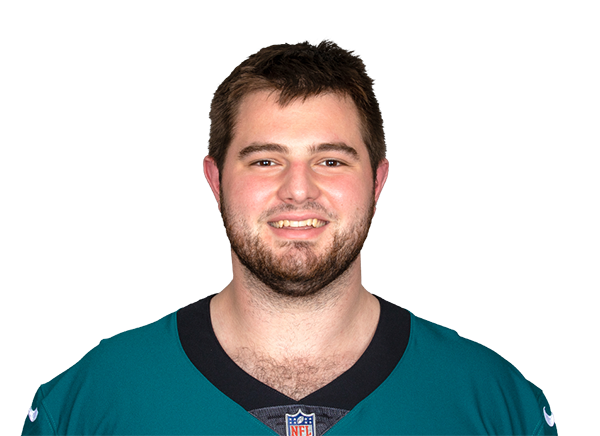 Landon Dickerson |
69 | G | Day-To-Day | 6' 6" | 332 lbs | 6 | Alabama |
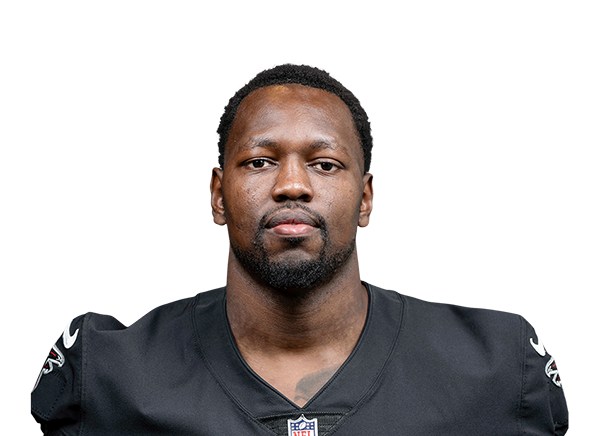 Arnold Ebiketie |
17 | LB | Active | 6' 3" | 256 lbs | 5 | Penn State |
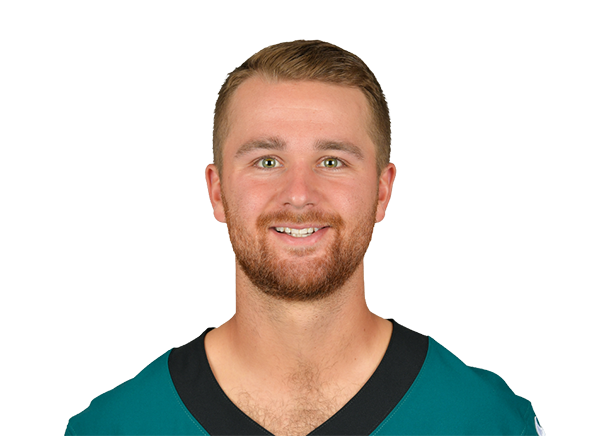 Jake Elliott |
4 | PK | Active | 5' 9" | 167 lbs | 10 | Memphis |
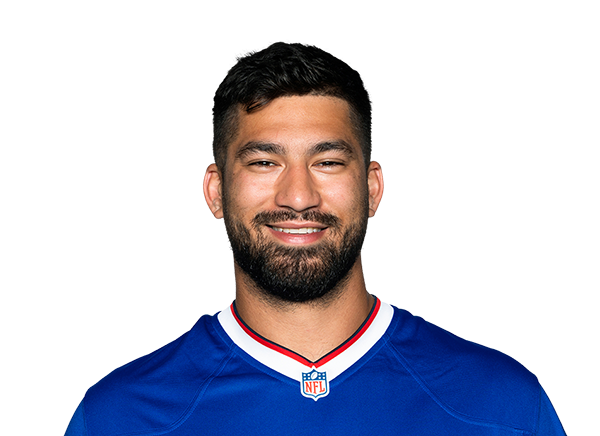 AJ Epenesa |
57 | DE | Active | 6' 6" | 280 lbs | 7 | Iowa |
 Marcus Epps |
29 | S | Active | 6' 0" | 198 lbs | 8 | Wyoming |
 Zach Ertz |
86 | TE | Active | 6' 5" | 250 lbs | 14 | Stanford |
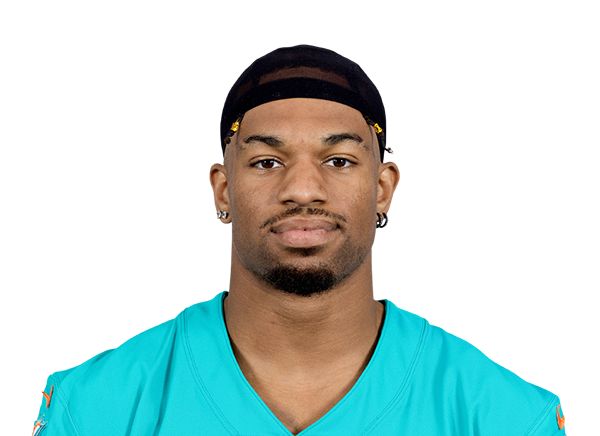 Erik Ezukanma |
82 | WR | Practice Squad | 6' 2" | 206 lbs | 4 | Texas Tech |
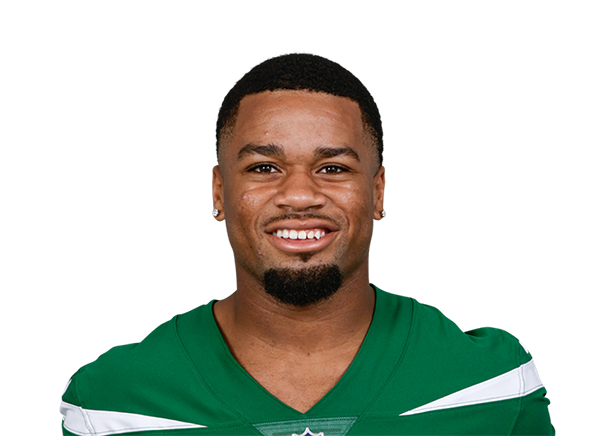 Xavier Gipson |
86 | WR | Practice Squad | 5' 9" | 189 lbs | 4 | Stephen F. Austin |
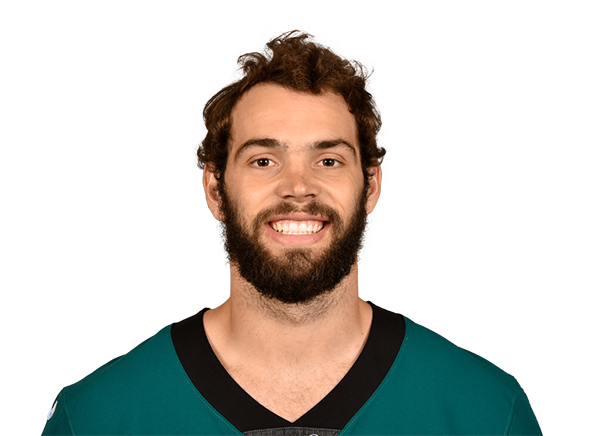 Dallas Goedert |
88 | TE | Active | 6' 5" | 256 lbs | 9 | South Dakota State |
 Jonathan Greenard |
52 | LB | Active | 6' 3" | 263 lbs | 7 | Florida |
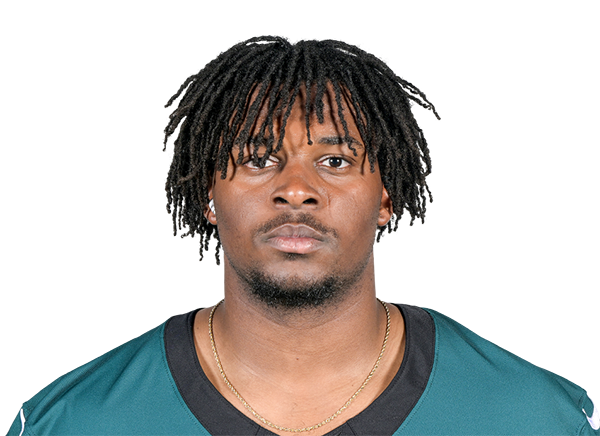 Gabe Hall |
96 | DT | Practice Squad | 6' 6" | 295 lbs | 1 | Baylor |
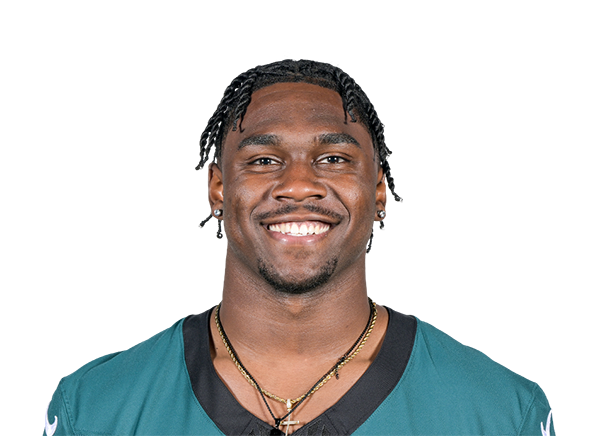 Jalyx Hunt |
58 | LB | Active | 6' 3" | 252 lbs | 3 | Houston Christian |
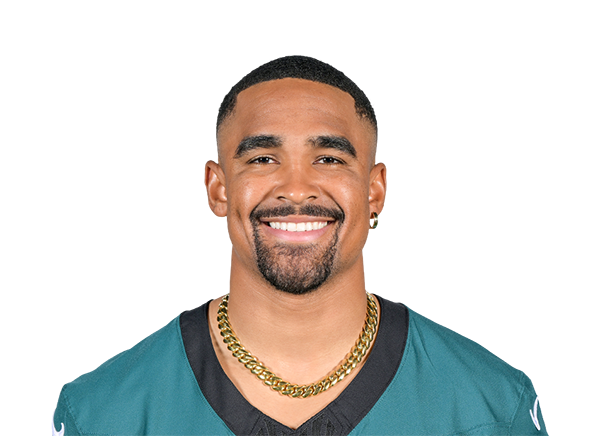 Jalen Hurts |
1 | QB | Day-To-Day | 6' 1" | 223 lbs | 7 | Oklahoma |
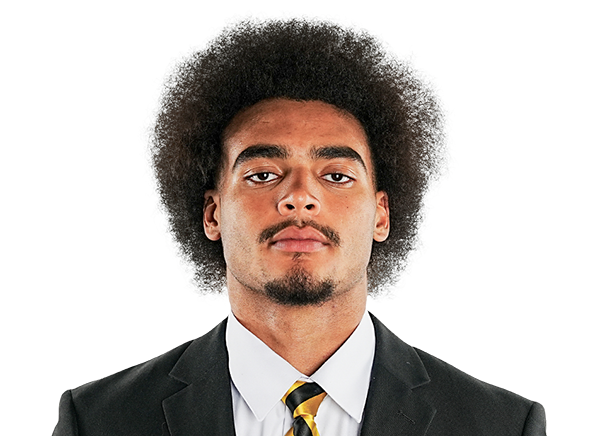 Keyshawn James-Newby |
50 | LB | Active | 6' 1" | 240 lbs | R | New Mexico |
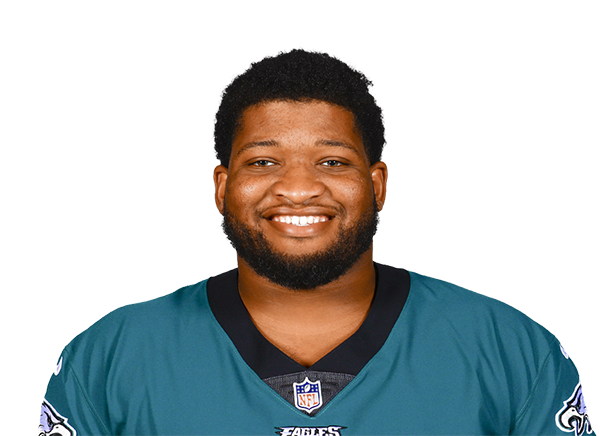 Fred Johnson |
74 | OT | Active | 6' 7" | 326 lbs | 8 | Florida |
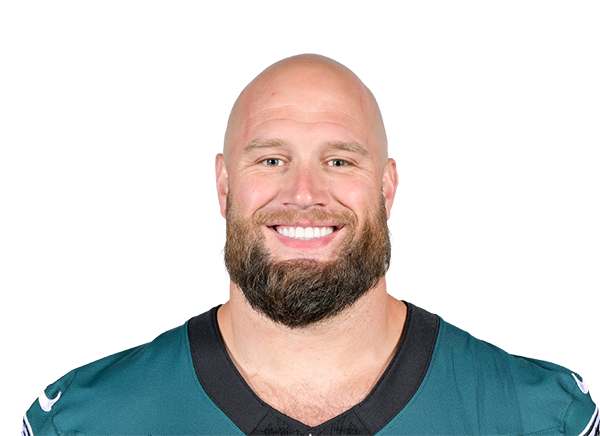 Lane Johnson |
65 | OT | Active | 6' 6" | 325 lbs | 14 | Oklahoma |
 Jonathan Jones |
31 | CB | Active | 5' 10" | 190 lbs | 11 | Auburn |
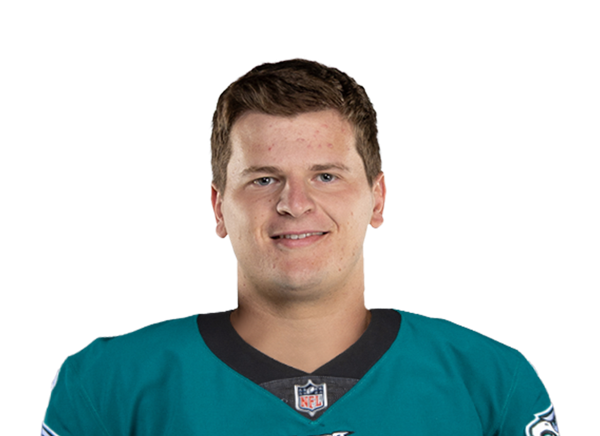 Drew Kendall |
66 | C | Active | 6' 4" | 308 lbs | 2 | Boston College |
 Willie Lampkin |
61 | C | Active | 5' 11" | 290 lbs | 2 | North Carolina |
 Tucker Large |
37 | S | Day-To-Day | 5' 11" | 185 lbs | R | Washington State |
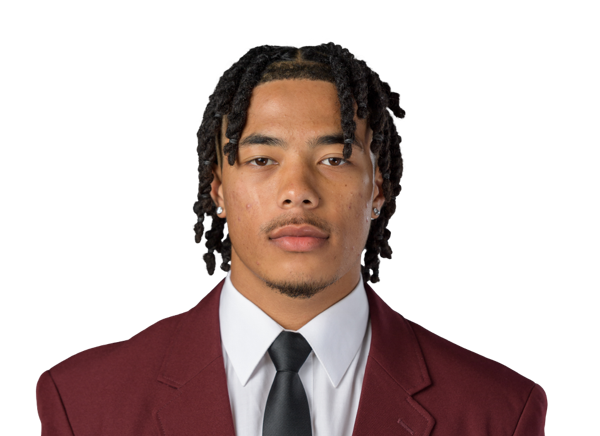 Makai Lemon |
9 | WR | Active | 5' 11" | 192 lbs | R | USC |
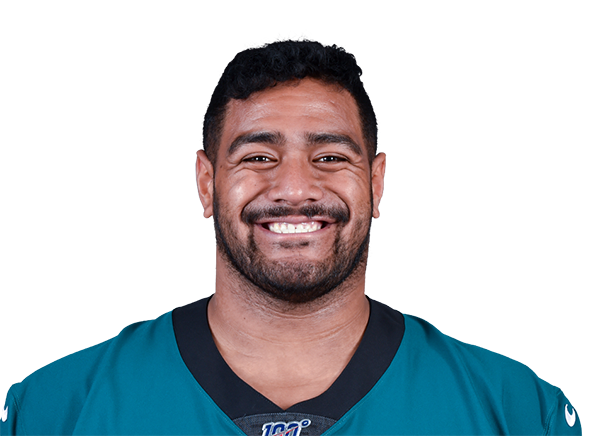 Jordan Mailata |
68 | OT | Active | 6' 8" | 365 lbs | 9 | - |
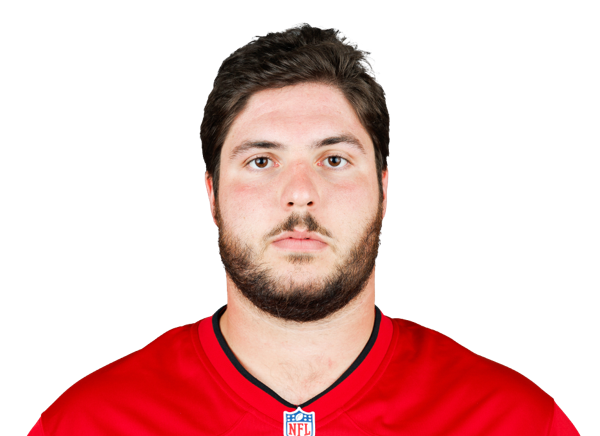 Jake Majors |
75 | C | Active | 6' 3" | 306 lbs | 1 | Texas |
 Braden Mann |
10 | P | Active | 5' 11" | 198 lbs | 7 | Texas A&M |
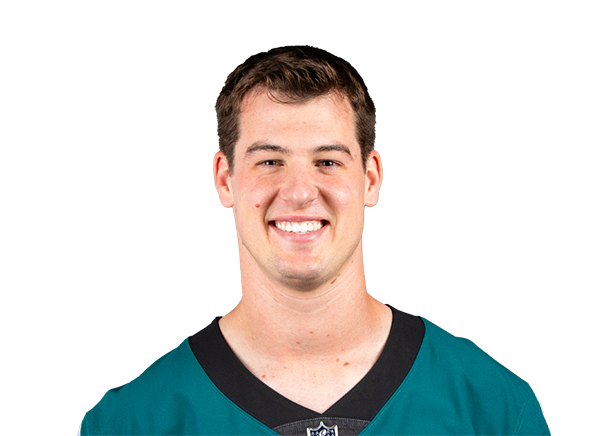 Tanner McKee |
16 | QB | Active | 6' 6" | 231 lbs | 4 | Stanford |
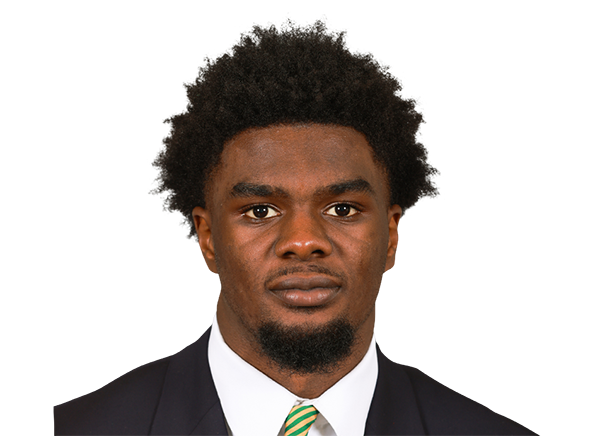 Mac McWilliams |
22 | CB | Active | 5' 10" | 191 lbs | 2 | UCF |
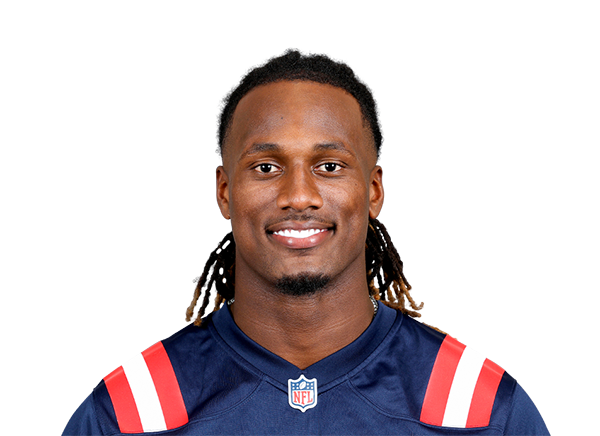 Joe Milton |
14 | QB | Active | 6' 5" | 236 lbs | 3 | Tennessee |
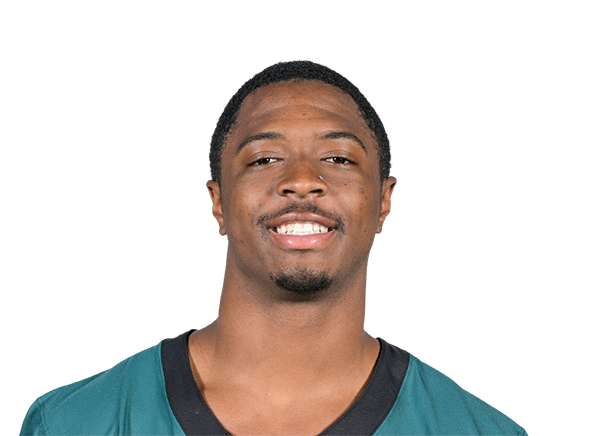 Quinyon Mitchell |
27 | CB | Active | 6' 0" | 193 lbs | 3 | Toledo |
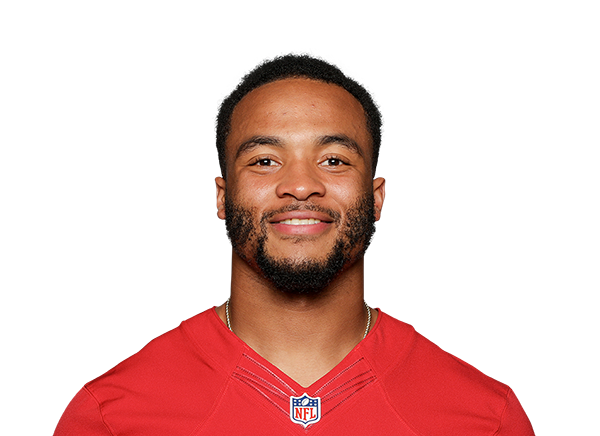 Elijah Mitchell |
38 | RB | Practice Squad | 5' 10" | 200 lbs | 6 | Louisiana |
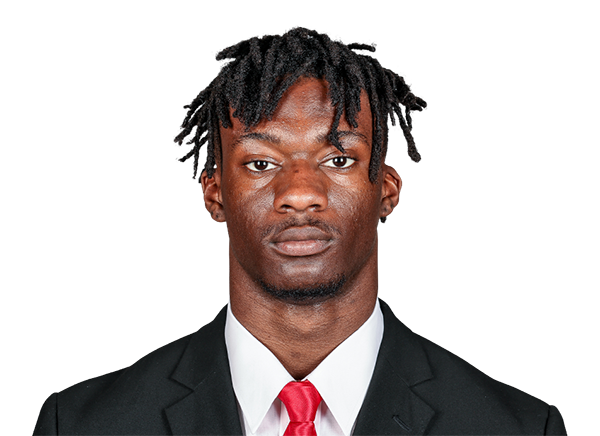 Smael Mondon Jr. |
42 | LB | Active | 6' 2" | 224 lbs | 2 | Georgia |
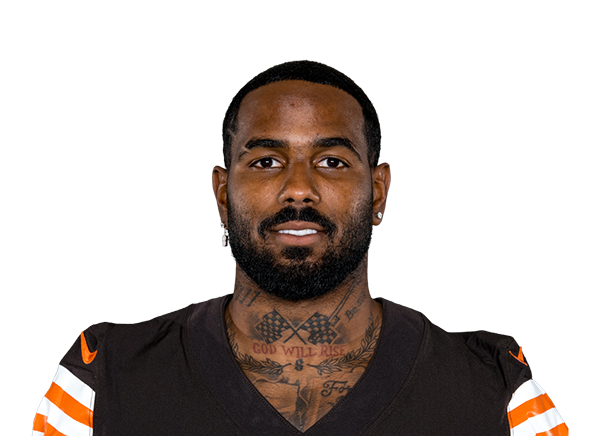 Elijah Moore |
19 | WR | Active | 5' 10" | 178 lbs | 6 | Ole Miss |
 Kenny Moore II |
23 | CB | Active | 5' 9" | 190 lbs | 10 | Valdosta State |
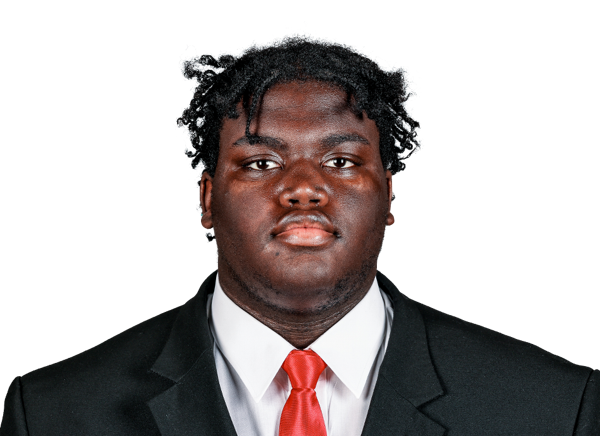 Micah Morris |
76 | G | Active | 6' 5" | 334 lbs | R | Georgia |
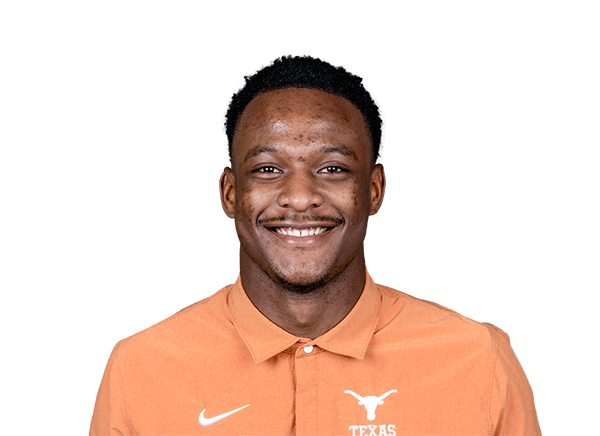 Andrew Mukuba |
24 | S | Active | 5' 11" | 186 lbs | 2 | Texas |
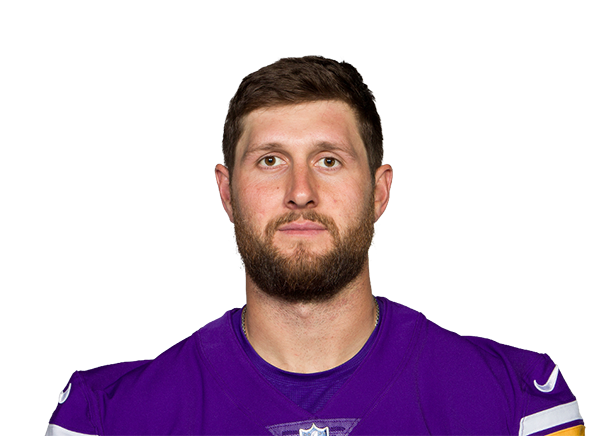 Johnny Mundt |
83 | TE | Active | 6' 4" | 245 lbs | 9 | Oregon |
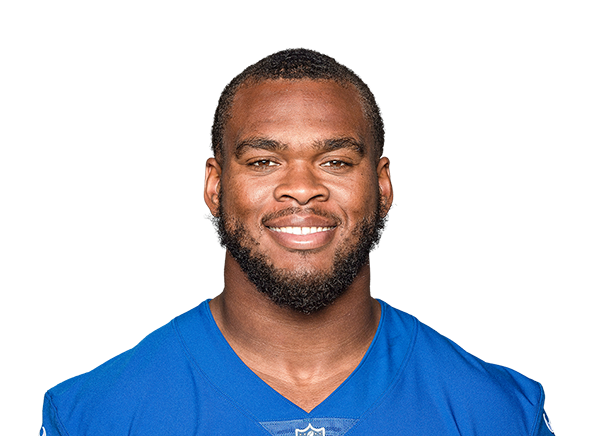 Evan Neal |
- | G | Practice Squad | 6' 7" | 340 lbs | R | Alabama |
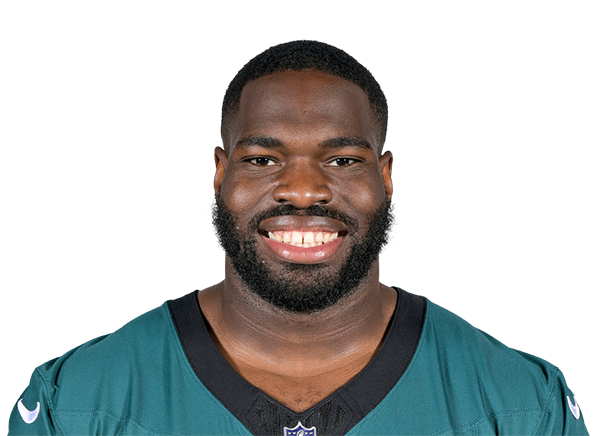 Moro Ojomo |
97 | DT | Active | 6' 3" | 292 lbs | 4 | Texas |
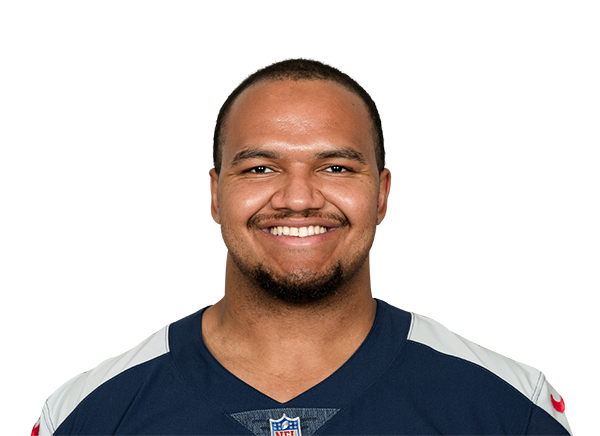 John Ojukwu |
67 | OT | Active | 6' 5" | 309 lbs | 2 | Boise State |
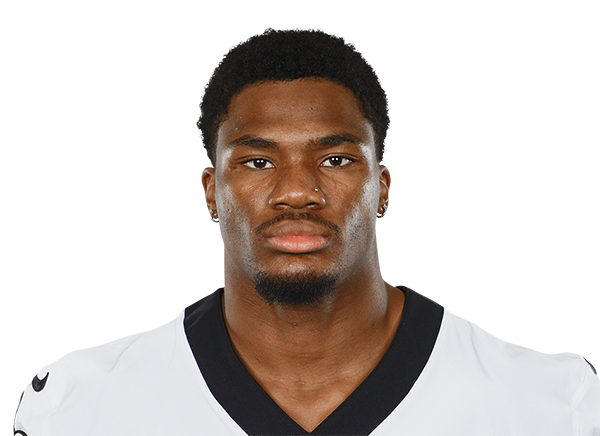 Anfernee Orji |
- | LB | Practice Squad | 6' 2" | 230 lbs | R | Vanderbilt |
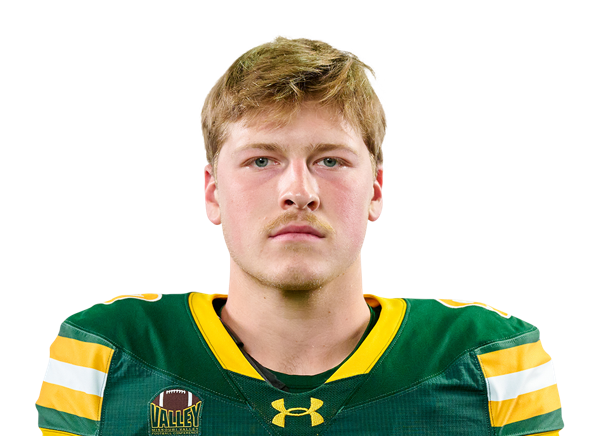 Cole Payton |
18 | QB | Active | 6' 2" | 232 lbs | R | North Dakota State |
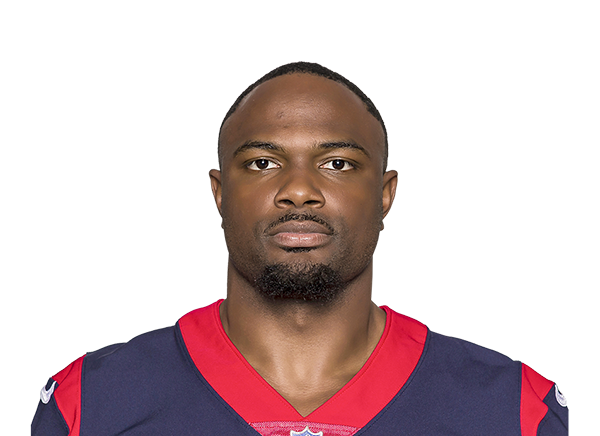 Dameon Pierce |
39 | RB | Active | 5' 10" | 218 lbs | 5 | Florida |
 Mason Reiger |
90 | LB | Practice Squad | 6' 4" | 251 lbs | R | Wisconsin |
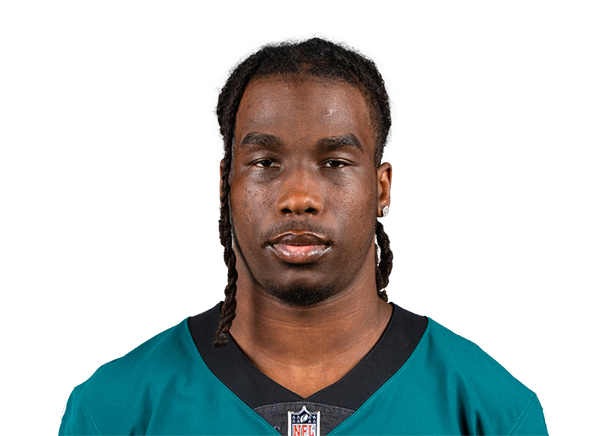 Kelee Ringo |
7 | CB | Active | 6' 2" | 207 lbs | 4 | Georgia |
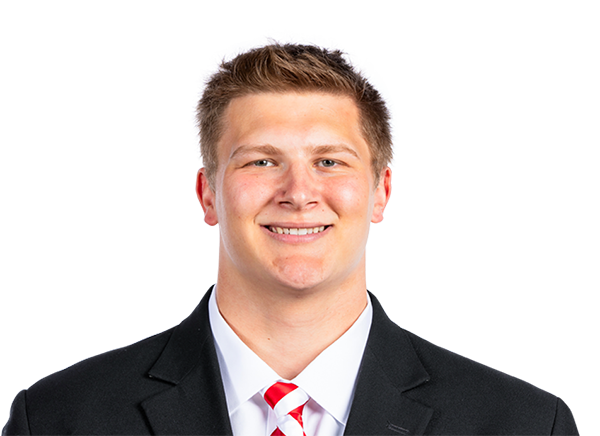 Ty Robinson |
95 | DT | Active | 6' 5" | 288 lbs | 2 | Nebraska |
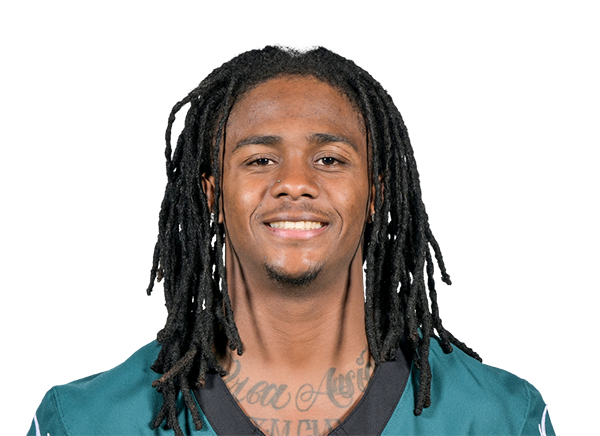 Andre' Sam |
31 | S | Day-To-Day | 5' 10" | 194 lbs | 1 | LSU |
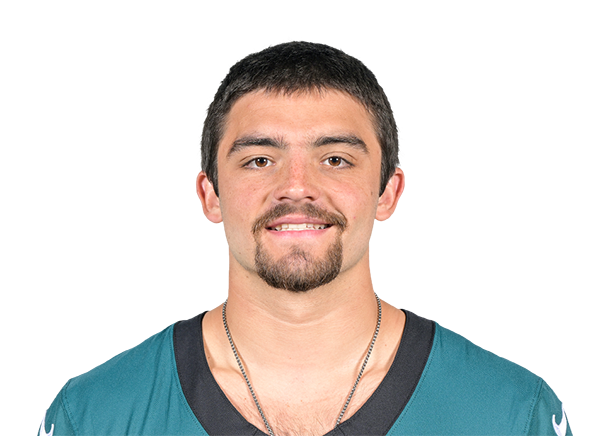 Will Shipley |
28 | RB | Day-To-Day | 5' 11" | 209 lbs | 3 | Clemson |
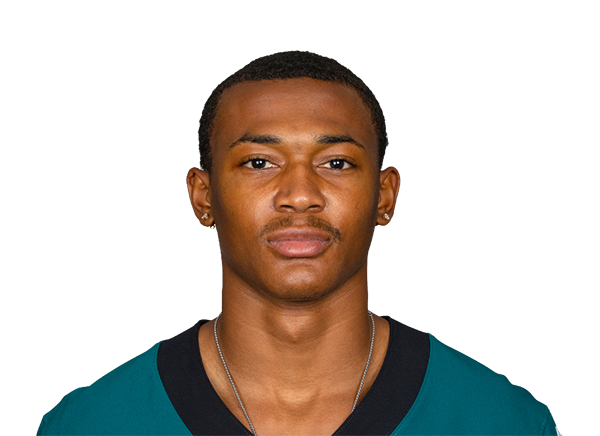 DeVonta Smith |
6 | WR | Active | 6' 0" | 170 lbs | 6 | Alabama |
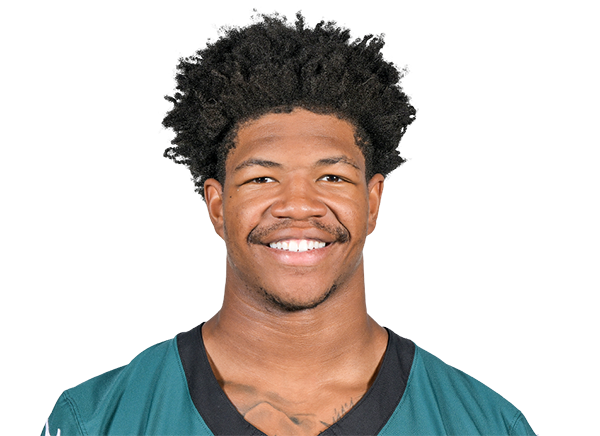 Nolan Smith Jr. |
3 | LB | Active | 6' 2" | 238 lbs | 4 | Georgia |
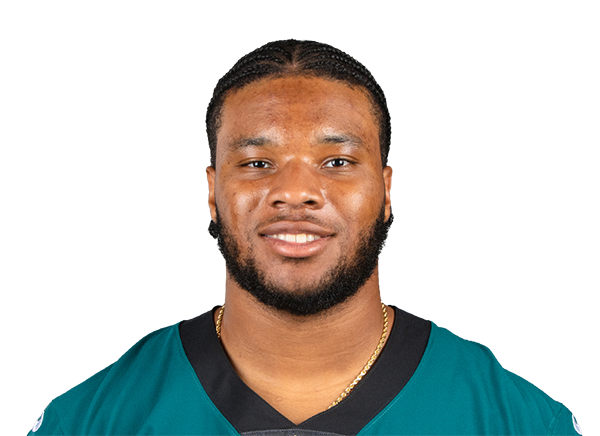 Tyler Steen |
56 | G | Active | 6' 6" | 321 lbs | 4 | Alabama |
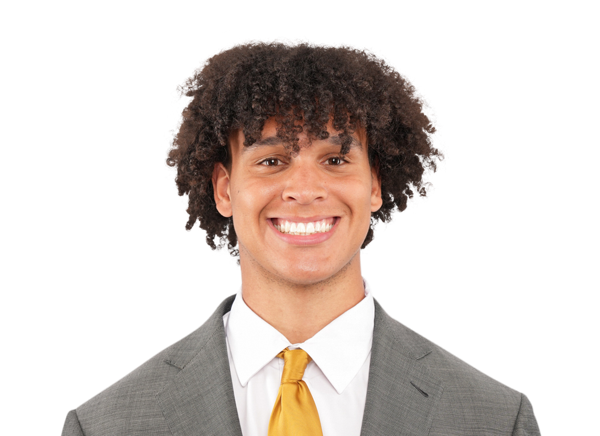 Eli Stowers |
87 | TE | Day-To-Day | 6' 4" | 239 lbs | R | Vanderbilt |
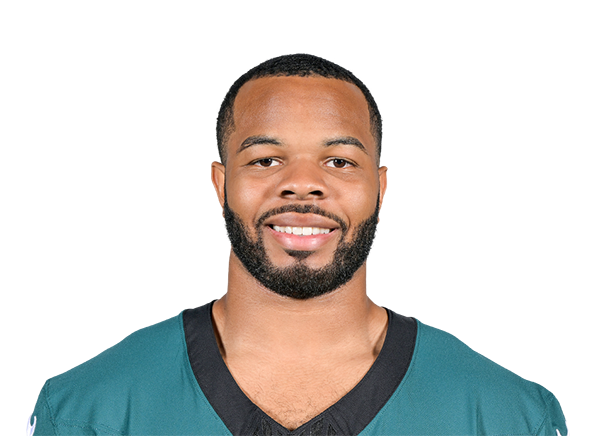 Jeremiah Trotter Jr. |
54 | LB | Active | 6' 0" | 225 lbs | 3 | Clemson |
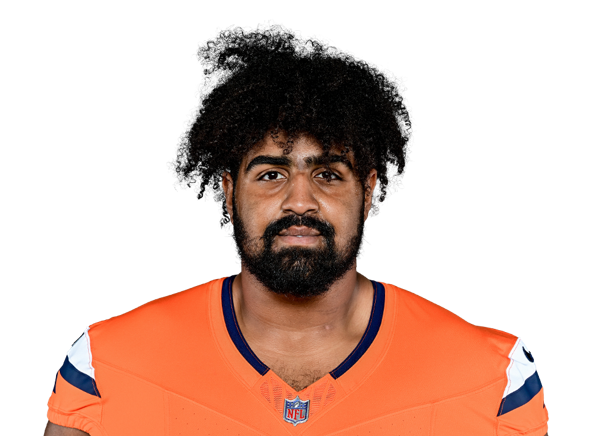 Xavier Truss |
- | OT | Practice Squad | 6' 7" | 320 lbs | R | Georgia |
 Rocco Underwood |
41 | LS | Active | 6' 3" | 231 lbs | R | Florida |
 Joshua Weru |
46 | LB | Practice Squad | 6' 4" | 244 lbs | R | - |
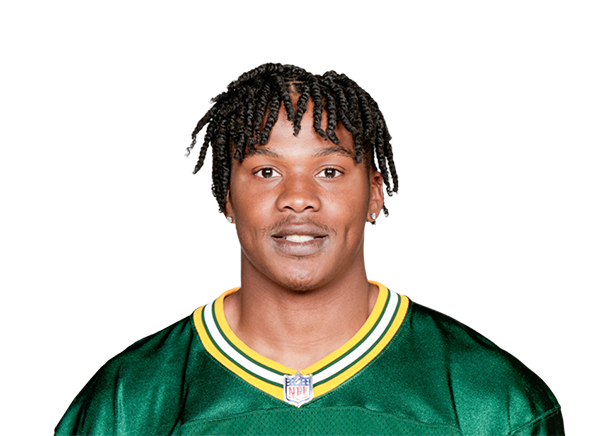 Dontayvion Wicks |
13 | WR | Active | 6' 1" | 206 lbs | 4 | Virginia |
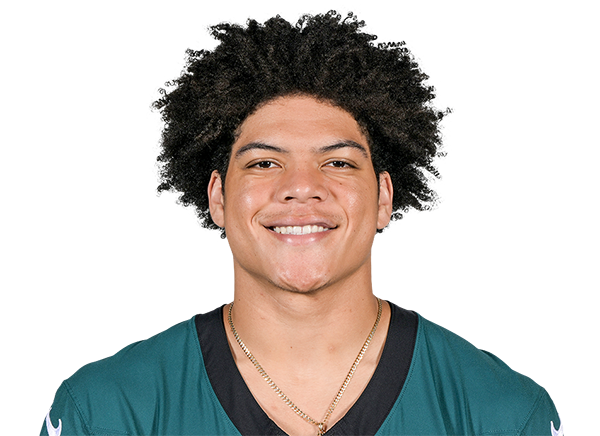 Johnny Wilson |
89 | WR | Day-To-Day | 6' 6" | 228 lbs | 3 | Florida State |
 Zion Wilson |
79 | DT | Practice Squad | 6' 3" | 316 lbs | R | East Carolina |
 Cole Wisniewski |
21 | S | Active | 6' 3" | 219 lbs | R | Texas Tech |
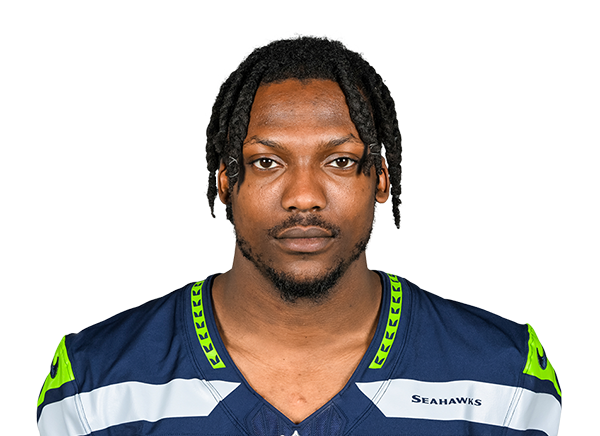 Riq Woolen |
2 | CB | Active | 6' 4" | 210 lbs | 5 | UTSA |
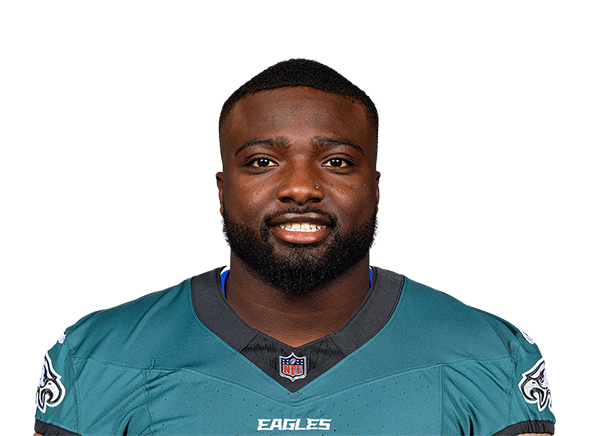 Byron Young |
94 | DT | Active | 6' 3" | 292 lbs | 4 | Alabama |
Philadelphia Eagles — Stats
Team Scoring
| Wins | 2 |
| Losses | 4 |
| Ties | 0 |
| Win % | 0.33333334 |
| Points For | 106 |
| Points Against | 137 |
| Point Differential | -31 |
| Streak | -4 |
| Division Record | 0 |
Passing
| Completion Percentage | 57.5 |
| Completions | 115 |
| Interception Percentage | 2.00 |
| Interceptions | 4 |
| Longest Pass | 64 |
| Net Passing Yards | 1,040 |
| Net Passing Yards Per Game | 173.3 |
| Passing Attempts | 200 |
| Passing Touchdown % | 4.50 |
| Passing Touchdowns | 9 |
| Passer Rating | 80.6 |
| Total Sacks | 16 |
| Sack Yards Lost | 108 |
| Yards Per Pass Attempt | 5.7 |
| Passing Yards | 1,148 |
| Passing Fumbles Lost | 1 |
| Team Games Played | 6 |
| Yards Per Game | 273.5 |
| Total Points Per Game | 17.7 |
| Total Points | 106 |
| Total Touchdowns | 13 |
| Passing Yards Per Game | 191.3 |
| Comp-Att | 115-200 |
| Sacks-Yards Lost | 16-108 |
Rushing
| Rushing Attempts | 134 |
| Rushing Yards | 493 |
| Yards Per Rush Attempt | 3.7 |
| Long Rushing | 42 |
| 20+ Yard Rushing Plays | 3 |
| Rushing Touchdowns | 4 |
| Rushing Yards Per Game | 82.2 |
| Rushing Fumbles | 1 |
| Rushing Fumbles Lost | 0 |
| Rushing 1st downs | 26 |
| Team Games Played | 6 |
| Total Yards | 1,641 |
| Total Offensive Plays | 350 |
| Total Points Per Game | 17.7 |
| Total Points | 106 |
| Total Touchdowns | 13 |
Receiving
| Receptions | 115 |
| Receiving Targets | 188 |
| Receiving Yards | 1,148 |
| Receiving Yards | 1,148 |
| Receiving Touchdowns | 9 |
| Long Reception | 64 |
| 20+ Yard Receiving Plays | 9 |
| Receiving Yards Per Game | 191.3 |
| Receiving Fumbles | 1 |
| Receiving Fumbles Lost | 1 |
| Receiving Yards After Catch | 422 |
| Receiving First Downs | 53 |
| Team Games Played | 6 |
| Yards Per Reception | 10.0 |
| Total Points Per Game | 17.7 |
| Total Points | 106 |
| Total Touchdowns | 13 |
Miscellaneous
| Total 1st downs | 89 |
| Rushing 1st downs | 26 |
| Passing 1st downs | 53 |
| 1st downs by penalty | 10 |
| Third Down Conversions | 31 |
| Third Down Attempts | 83 |
| 3rd down % | 37.35 |
| Fourth Down Conversions | 2 |
| First Downs Attempts | 10 |
| 4th down % | 20.00 |
| Total Penalties | 47 |
| Total Penalty Yards | 320 |
| Possession Time Seconds | 9862 |
| Red Zone Field Goal Percentage | 12.50 |
| Red Zone Scoring Percentage | 81.25 |
| Red Zone Efficiency Percentage | 74.11 |
| Red Zone Touchdown Percentage | 68.75 |
| Total Takeaways | 3 |
| Total Giveaways | 5 |
| Turnover Ratio | -2 |
| Fumbles Lost | 1 |
| 3rd down efficiency | 31-83 |
| 4th down efficiency | 2-10 |
| Total-Yards | 47-320 |
Defense
| Solo Tackles | 250 |
| Assist Tackles | 180 |
| Total Tackles | 430 |
| Sacks | 8 |
| Sack Yards | 56 |
| Stuffs | 30 |
| Passes Defended | 32 |
| Average Interception Yards | 15.3 |
| Long Interception | 25 |
| Miscellaneous Touchdowns | 0 |
| Kicks Blocked | 1 |
| Tackles For Loss | 24 |
| Team Games Played | 6 |
Defensive Interceptions
| Interceptions | 3 |
| Interception Yards | 46 |
| Interception Touchdowns | 0 |
| INT: Total | 3-46 |
General
| Fumbles | 6 |
| Forced Fumbles | 6 |
| Fumbles Recovered | 0 |
| Fumbles Touchdowns | 0 |
| Games Played | 6 |
| Fumbles-Lost | 6-1 |
Returning
| Kick Returns | 19 |
| Kick Return Yards | 420 |
| Yards Per Kick Return | 22.1 |
| Long Kick Return | 42 |
| Kick Return Touchdowns | 0 |
| Punt Returns | 14 |
| Punt Return Yards | 177 |
| Yards Per Punt Return | 12.6 |
| Long Punt Return | 41 |
| Punt Return Touchdowns | 0 |
| Punt Return Fair Catches | 5 |
| Kick Return Fumbles Lost | 0 |
| Punt Return Fumbles Lost | 0 |
| Team Games Played | 6 |
| Punt: Total | 14-177 |
Kicking
| Field Goal Made | 5 |
| Field Goal Attempts | 5 |
| Field Goal Percentage | 100.0 |
| Long Field Goal Made | 58 |
| Field Goal Attempts 1-19 | 0 |
| Field Goal Attempts 20-29 | 1 |
| Field Goal Attempts 30-39 | 1 |
| Field Goal Attempts 40-49 | 1 |
| Field Goal Attempts 50+ | 2 |
| Extra Points Made | 13 |
| Extra Point Attempts | 13 |
| Extra Point Percentage | 100.0 |
| Field Goals Made 1-19 | 0 |
| Field Goals Made 20-29 | 1 |
| Field Goals Made 30-39 | 1 |
| Field Goals Made 40-49 | 1 |
| Field Goals Made 50+ | 2 |
| Total Kicking Points | 28 |
| Team Games Played | 6 |
| Touchback Percentage | 9 |
| Average Kickoff Return Yards | 26.4 |
| Kickoff Return Yards | 555 |
| Kickoff Returns | 21 |
| Kickoffs: Total | 21-555 |
| FG: Good-Attempts | 5-5 |
Punting
| Punts | 33 |
| Punt Yards | 1,574 |
| Long Punt | 65 |
| Gross Average Punt Yards | 47.7 |
| Net Average Punt Yards | 42.4 |
| Punts Blocked | 0 |
| Punts Inside 20 | 14 |
| Touchbacks | 1 |
| Fair Catches | 4 |
| Punt Returns | 18 |
| Punt Return Yards | 175 |
| Average Punt Return Yards | 9.7 |
| Team Games Played | 6 |
| Punt: Total Yards | 33-1,574 |
Scoring
| Rushing Touchdowns | 4 |
| Receiving Touchdowns | 9 |
| Return Touchdowns | 0 |
| Total Touchdowns | 13 |
| Field Goals | 5 |
| Kick Extra Points | 13 |
| Total Two Point Conversions | 0 |
| Total Points | 106 |
| Total Points Per Game | 17.7 |
Passing
| Completion Percentage | 60.4 |
| Completions | 131 |
| Interception Percentage | 1.38 |
| Interceptions | 3 |
| Longest Pass | 51 |
| Net Passing Yards | 1,467 |
| Net Passing Yards Per Game | 244.5 |
| Passing Attempts | 217 |
| Passing Touchdown % | 3.69 |
| Passing Touchdowns | 8 |
| Passer Rating | 88.2 |
| Total Sacks | 8 |
| Sack Yards Lost | 56 |
| Yards Per Pass Attempt | 7.0 |
| Passing Yards | 1,523 |
| Passing Fumbles Lost | 0 |
| Team Games Played | 6 |
| Yards Per Game | 373.2 |
| Total Points Per Game | 22.8 |
| Total Points | 137 |
| Total Touchdowns | 16 |
| Passing Yards Per Game | 253.8 |
| Comp-Att | 131-217 |
| Sacks-Yards Lost | 8-56 |
Rushing
| Rushing Attempts | 181 |
| Rushing Yards | 716 |
| Yards Per Rush Attempt | 4.0 |
| Long Rushing | 27 |
| 20+ Yard Rushing Plays | 2 |
| Rushing Touchdowns | 8 |
| Rushing Yards Per Game | 119.3 |
| Rushing Fumbles | 2 |
| Rushing Fumbles Lost | 0 |
| Rushing 1st downs | 44 |
| Team Games Played | 6 |
| Total Yards | 2,239 |
| Total Offensive Plays | 406 |
| Total Points Per Game | 22.8 |
| Total Points | 137 |
| Total Touchdowns | 16 |
Receiving
| Receptions | 131 |
| Receiving Targets | 203 |
| Receiving Yards | 1,523 |
| Receiving Yards | 1,523 |
| Receiving Touchdowns | 8 |
| Long Reception | 51 |
| 20+ Yard Receiving Plays | 19 |
| Receiving Yards Per Game | 253.8 |
| Receiving Fumbles | 2 |
| Receiving Fumbles Lost | 0 |
| Receiving Yards After Catch | 637 |
| Receiving First Downs | 70 |
| Team Games Played | 6 |
| Yards Per Reception | 11.6 |
| Total Points Per Game | 22.8 |
| Total Points | 137 |
| Total Touchdowns | 16 |
Miscellaneous
| Total 1st downs | 127 |
| Rushing 1st downs | 44 |
| Passing 1st downs | 70 |
| 1st downs by penalty | 13 |
| Third Down Conversions | 35 |
| Third Down Attempts | 90 |
| 3rd down % | 38.89 |
| Fourth Down Conversions | 9 |
| First Downs Attempts | 13 |
| 4th down % | 69.23 |
| Total Penalties | 52 |
| Total Penalty Yards | 484 |
| Possession Time Seconds | 11738 |
| Red Zone Field Goal Percentage | 20.83 |
| Red Zone Scoring Percentage | 75.00 |
| Red Zone Efficiency Percentage | 63.10 |
| Red Zone Touchdown Percentage | 54.17 |
| Total Takeaways | 5 |
| Total Giveaways | 3 |
| Turnover Ratio | 2 |
| Fumbles Lost | 0 |
| 3rd down efficiency | 35-90 |
| 4th down efficiency | 9-13 |
| Total-Yards | 52-484 |
Defense
| Solo Tackles | 217 |
| Assist Tackles | 130 |
| Total Tackles | 347 |
| Sacks | 16 |
| Sack Yards | 108 |
| Stuffs | 32 |
| Passes Defended | 24 |
| Average Interception Yards | 23.8 |
| Long Interception | 92 |
| Miscellaneous Touchdowns | 0 |
| Kicks Blocked | 0 |
| Tackles For Loss | 42 |
| Team Games Played | 6 |
Defensive Interceptions
| Interceptions | 4 |
| Interception Yards | 95 |
| Interception Touchdowns | 0 |
| INT: Total | 4-95 |
General
| Fumbles | 6 |
| Forced Fumbles | 2 |
| Fumbles Recovered | 1 |
| Fumbles Touchdowns | 0 |
| Games Played | 6 |
| Fumbles-Lost | 6-0 |
Returning
| Kick Returns | 21 |
| Kick Return Yards | 555 |
| Yards Per Kick Return | 26.4 |
| Long Kick Return | 53 |
| Kick Return Touchdowns | 0 |
| Punt Returns | 18 |
| Punt Return Yards | 175 |
| Yards Per Punt Return | 9.7 |
| Long Punt Return | 24 |
| Punt Return Touchdowns | 0 |
| Punt Return Fair Catches | 4 |
| Kick Return Fumbles Lost | 0 |
| Punt Return Fumbles Lost | 0 |
| Team Games Played | 6 |
| Punt: Total | 18-175 |
Kicking
| Field Goal Made | 10 |
| Field Goal Attempts | 12 |
| Field Goal Percentage | 83.3 |
| Long Field Goal Made | 57 |
| Field Goal Attempts 1-19 | 0 |
| Field Goal Attempts 20-29 | 1 |
| Field Goal Attempts 30-39 | 3 |
| Field Goal Attempts 40-49 | 4 |
| Field Goal Attempts 50+ | 4 |
| Extra Points Made | 11 |
| Extra Point Attempts | 14 |
| Extra Point Percentage | 78.6 |
| Field Goals Made 1-19 | 0 |
| Field Goals Made 20-29 | 1 |
| Field Goals Made 30-39 | 3 |
| Field Goals Made 40-49 | 3 |
| Field Goals Made 50+ | 3 |
| Total Kicking Points | 41 |
| Team Games Played | 6 |
| Touchback Percentage | 23 |
| Average Kickoff Return Yards | 22.1 |
| Kickoff Return Yards | 420 |
| Kickoff Returns | 19 |
| Kickoffs: Total | 19-420 |
| FG: Good-Attempts | 10-12 |
Punting
| Punts | 26 |
| Punt Yards | 1,278 |
| Long Punt | 65 |
| Gross Average Punt Yards | 49.2 |
| Net Average Punt Yards | 42.3 |
| Punts Blocked | 0 |
| Punts Inside 20 | 5 |
| Touchbacks | 4 |
| Fair Catches | 5 |
| Punt Returns | 14 |
| Punt Return Yards | 177 |
| Average Punt Return Yards | 12.6 |
| Team Games Played | 6 |
| Punt: Total Yards | 26-1,278 |
Scoring
| Rushing Touchdowns | 8 |
| Receiving Touchdowns | 8 |
| Return Touchdowns | 0 |
| Total Touchdowns | 16 |
| Field Goals | 10 |
| Kick Extra Points | 11 |
| Total Two Point Conversions | 0 |
| Total Points | 137 |
| Total Points Per Game | 22.8 |


